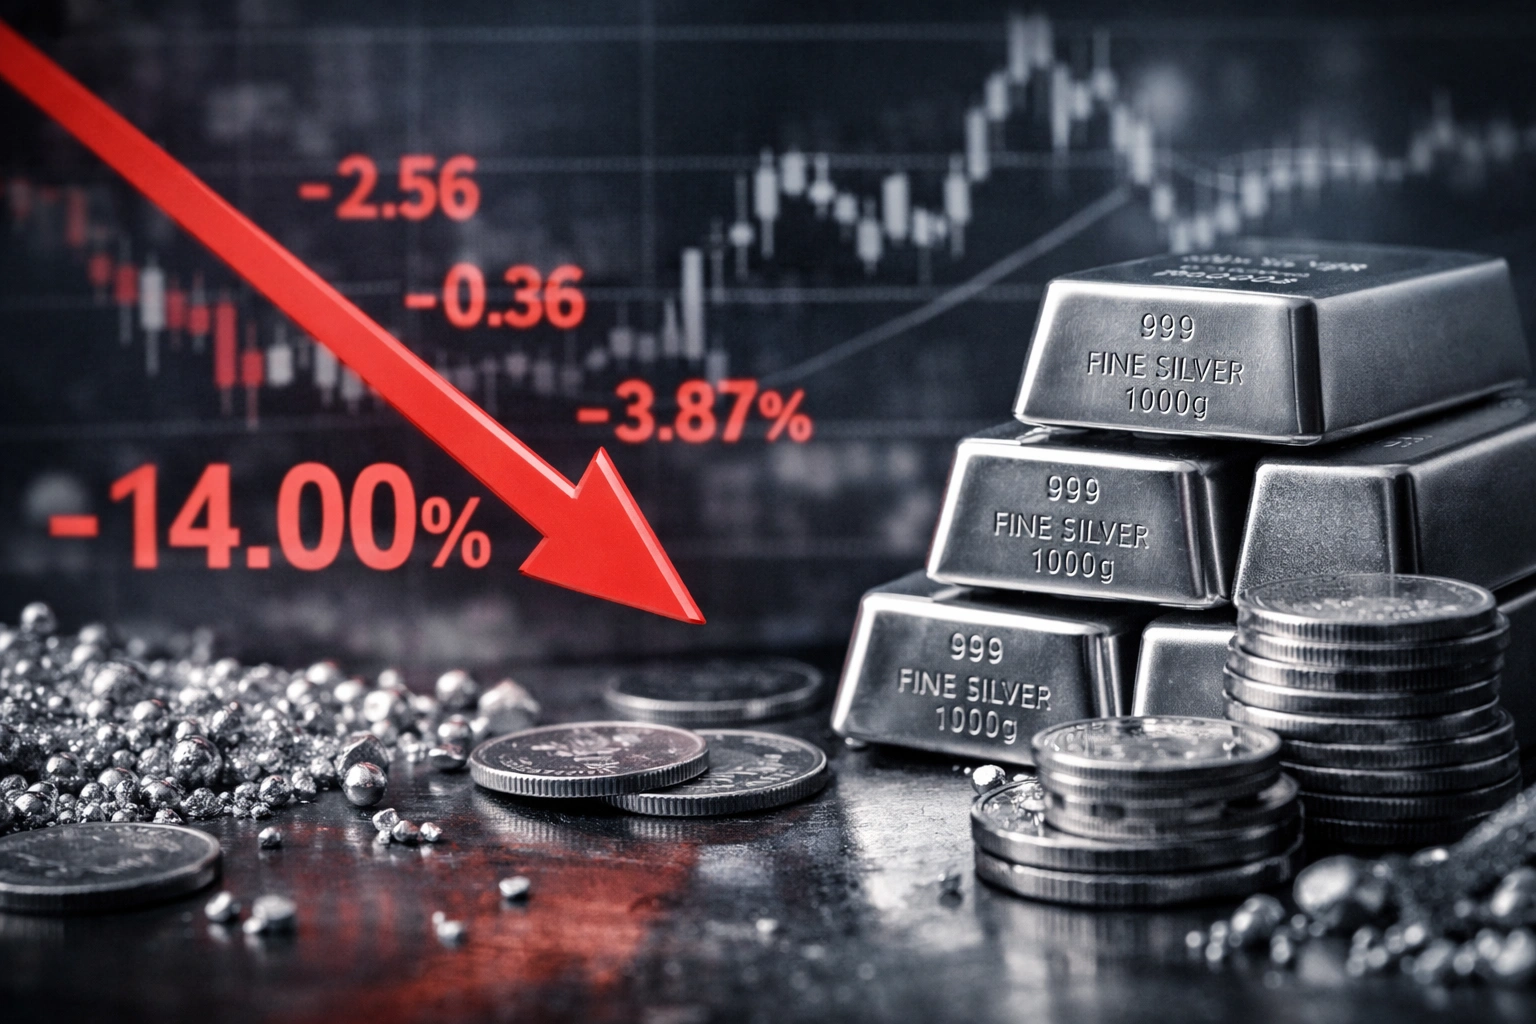
Coin Newsweek – March 3, 2026 (16:30 UTC) – Silver markets experienced a historic collapse today, with prices tumbling as much as 14% to briefly touch the $80 per ounce level. The white metal, which had surged to $94 just days ago on escalating Middle East tensions, has now erased all those gains in a brutal reversal that caught many traders off guard.
At the time of writing, spot silver is trading at $79.84, down a staggering 14.02% on the day. The sell-off accelerated through European and US trading hours as stop-loss levels were breached and leveraged positions were forced to unwind. This marks the lowest price for silver since the initial rally began following the US-Israeli strikes on Iran last week.

Chart 1: Silver 1-hour chart showing price collapse to $81.96, key moving averages, and RSI at 31.39 (Source: TradingView)
Chart Analysis: A Technical Breakdown
The 1-hour chart reveals the severity of today’s collapse. Silver is currently trading at $81.96, having broken decisively below all three major exponential moving averages. The 50-period EMA sits at $89.06, the 100-period EMA at $88.99, and the 200-period EMA at $87.22—all now serving as resistance levels that must be reclaimed for any bullish reversal.
The Relative Strength Index (RSI) has plunged to 31.39, approaching oversold territory. While readings below 30 would signal extreme selling pressure, the current level suggests momentum remains firmly bearish. The RSI’s decline from 38.26 indicates accelerating selling pressure rather than stabilization.
Price action shows a clean break below the psychological $88 support level, followed by a cascade through $86 and $84 before finding temporary footing near $81.96. The next major support level sits at $79.28, with a deeper move potentially targeting $77.27 if selling pressure continues.
The Anatomy of a Crash: 5 Key Factors Behind Today’s Collapse
Market analysts point to a confluence of factors that transformed what might have been a routine pullback into a full-blown liquidation event.
1. The “Warsh Effect” and Surging Dollar: President Trump’s nomination of Kevin Warsh, a known inflation hawk, to a key Federal Reserve position sent shockwaves through rate-sensitive markets. The US Dollar Index (DXY) surged approximately 1.5% to 99.20, its highest level in weeks, as markets priced in a more aggressive monetary policy stance. A stronger dollar makes dollar-denominated commodities like silver more expensive for international buyers, triggering immediate selling pressure.
2. Mass Profit-Taking After the Geopolitical Spike: Silver had experienced a parabolic rise following the closure of the Strait of Hormuz and escalating conflict. Prices briefly touched $94, creating substantial paper profits for short-term traders. When the initial panic subsided and no immediate escalation materialized over the weekend, profit-taking began in earnest, quickly snowballing as more sellers joined the exit.
3. Forced Liquidation of “Crowded” Long Positions: Technical analysts noted that speculative positioning had become extremely crowded. When the price broke below key support levels, it triggered a cascade of automated stop-loss orders and margin calls. The two-day collapse of 13% from Monday’s peak forced many leveraged traders to capitulate. This dynamic is often described as a “long squeeze,” where selling begets more selling.
4. Fed Rate Cut Expectations Pushed Back: The combination of a strong dollar and the hawkish signal from the Warsh nomination has caused markets to dramatically re-evaluate the timeline for Federal Reserve rate cuts. Expectations for the first cut have now shifted to September, removing a key support pillar for non-yielding assets like silver.
5. ETF Outflows Accelerate: Major silver ETFs have seen significant redemptions, with the iShares Silver Trust reporting approximately $350 million in outflows over the past two sessions. This institutional selling adds substantial weight to the downward pressure.
Technical Levels in Focus
The 1-hour chart provides clear levels for traders to monitor. Resistance now sits at the broken support zone of $87.22-$89.06, with the 200-period EMA at $87.22 acting as the first major hurdle. A recovery above this level would suggest potential stabilization, while failure to reclaim it would reinforce bearish momentum.
On the downside, immediate support is at $81.96 (today’s low), followed by $79.28 and the $77.27 level from late February. The RSI at 31.39 suggests that while selling pressure is intense, the market has not yet reached the oversold extreme (below 30) that often precedes a technical bounce.
Analyst Outlook: What’s Next for Silver?
Jeffrey Christian, managing partner of CPM Group, warns that further downside could be in store. “In a worst-case scenario, we could see silver test the $68 level before finding its footing,” he noted. However, he also pointed out that the fundamental drivers for silver—including industrial demand and its role as a monetary metal—remain intact.
Heraeus analysts emphasize that geopolitical developments will continue to dictate near-term direction. “The market’s focus will remain squarely on the Middle East. Any escalation could quickly reverse today’s losses, while de-escalation would likely extend the pullback,” they stated.
Jose Torres, senior economist at Interactive Brokers, framed the sell-off in the context of speculative excess. “When you get a significant and crowded speculative position built up, the risk of a violent reversal is always present. That’s exactly what we’re witnessing today,” he commented.
The Bigger Picture: What This Means for Investors
Today’s 14% collapse serves as a stark reminder of silver’s inherent volatility and its sensitivity to shifts in monetary policy expectations and currency markets. For long-term investors, the key question is whether this represents a buying opportunity or the beginning of a deeper correction.
The answer likely depends on how the geopolitical situation evolves and whether the recent hawkish shift in Fed expectations proves durable. If tensions in the Middle East reignite, silver could quickly reclaim its safe-haven premium. Conversely, if de-escalation continues and the dollar maintains its strength, further downside may be in store.
The 1-hour chart suggests that selling momentum remains strong, with no clear reversal signals yet evident. Traders should watch for a potential bounce from oversold RSI levels, but any recovery would need to reclaim the $87 area to suggest a true trend change.
For now, silver traders are licking their wounds after one of the most brutal sessions in recent memory. The 14% decline has reset positioning, cleared out excessive leverage, and brought prices back to levels that may attract value-oriented buyers. Whether that proves sufficient to stem the selling will become clear in the sessions ahead.
Sources: TradingView / CPM Group / Heraeus / Interactive Brokers / iShares Silver Trust
Disclaimer: This content is for market information only and is not investment advice.

