
Coin Newsweek – February 26, 2026 – Bitcoin has staged an impressive rebound over the past 24 hours, surging nearly 5% to briefly touch the psychologically significant $70,000 level before retreating toward $68,000. The move represents a recovery of approximately 12% from the February 24 low, marking one of the strongest short-term bounces in recent weeks.
However, despite this powerful price action, Bitcoin failed to establish a foothold above $70,000—a hesitation that analysts say reflects deeper structural issues limiting the sustainability of this recovery. Multiple data points now indicate that while early buy signals are emerging, market conviction remains notably weak.
According to Dessislava Ianeva, Research Analyst at Nexo, Bitcoin must clear the critical $70,000 to $70,800 resistance zone for this recovery to gain credibility. Until then, the rally remains incomplete and vulnerable to reversal.
Smart Money Signals Price Recovery, But Breakout Still Needs Confirmation
Bitcoin’s recent rebound did not occur without warning. The Smart Money Index (SMI), which tracks the trading behavior of informed institutional investors, began rising on February 24—often a precursor to strategic positioning by experienced market participants. When this index rises, it suggests that sophisticated traders may be building positions ahead of broader market moves.
The last time this pattern emerged was February 13, when the SMI started moving toward its signal line. On that occasion, Bitcoin subsequently climbed approximately 7% over two days. This time, the move was substantially stronger, with a 12% surge that briefly pushed prices to $70,000.
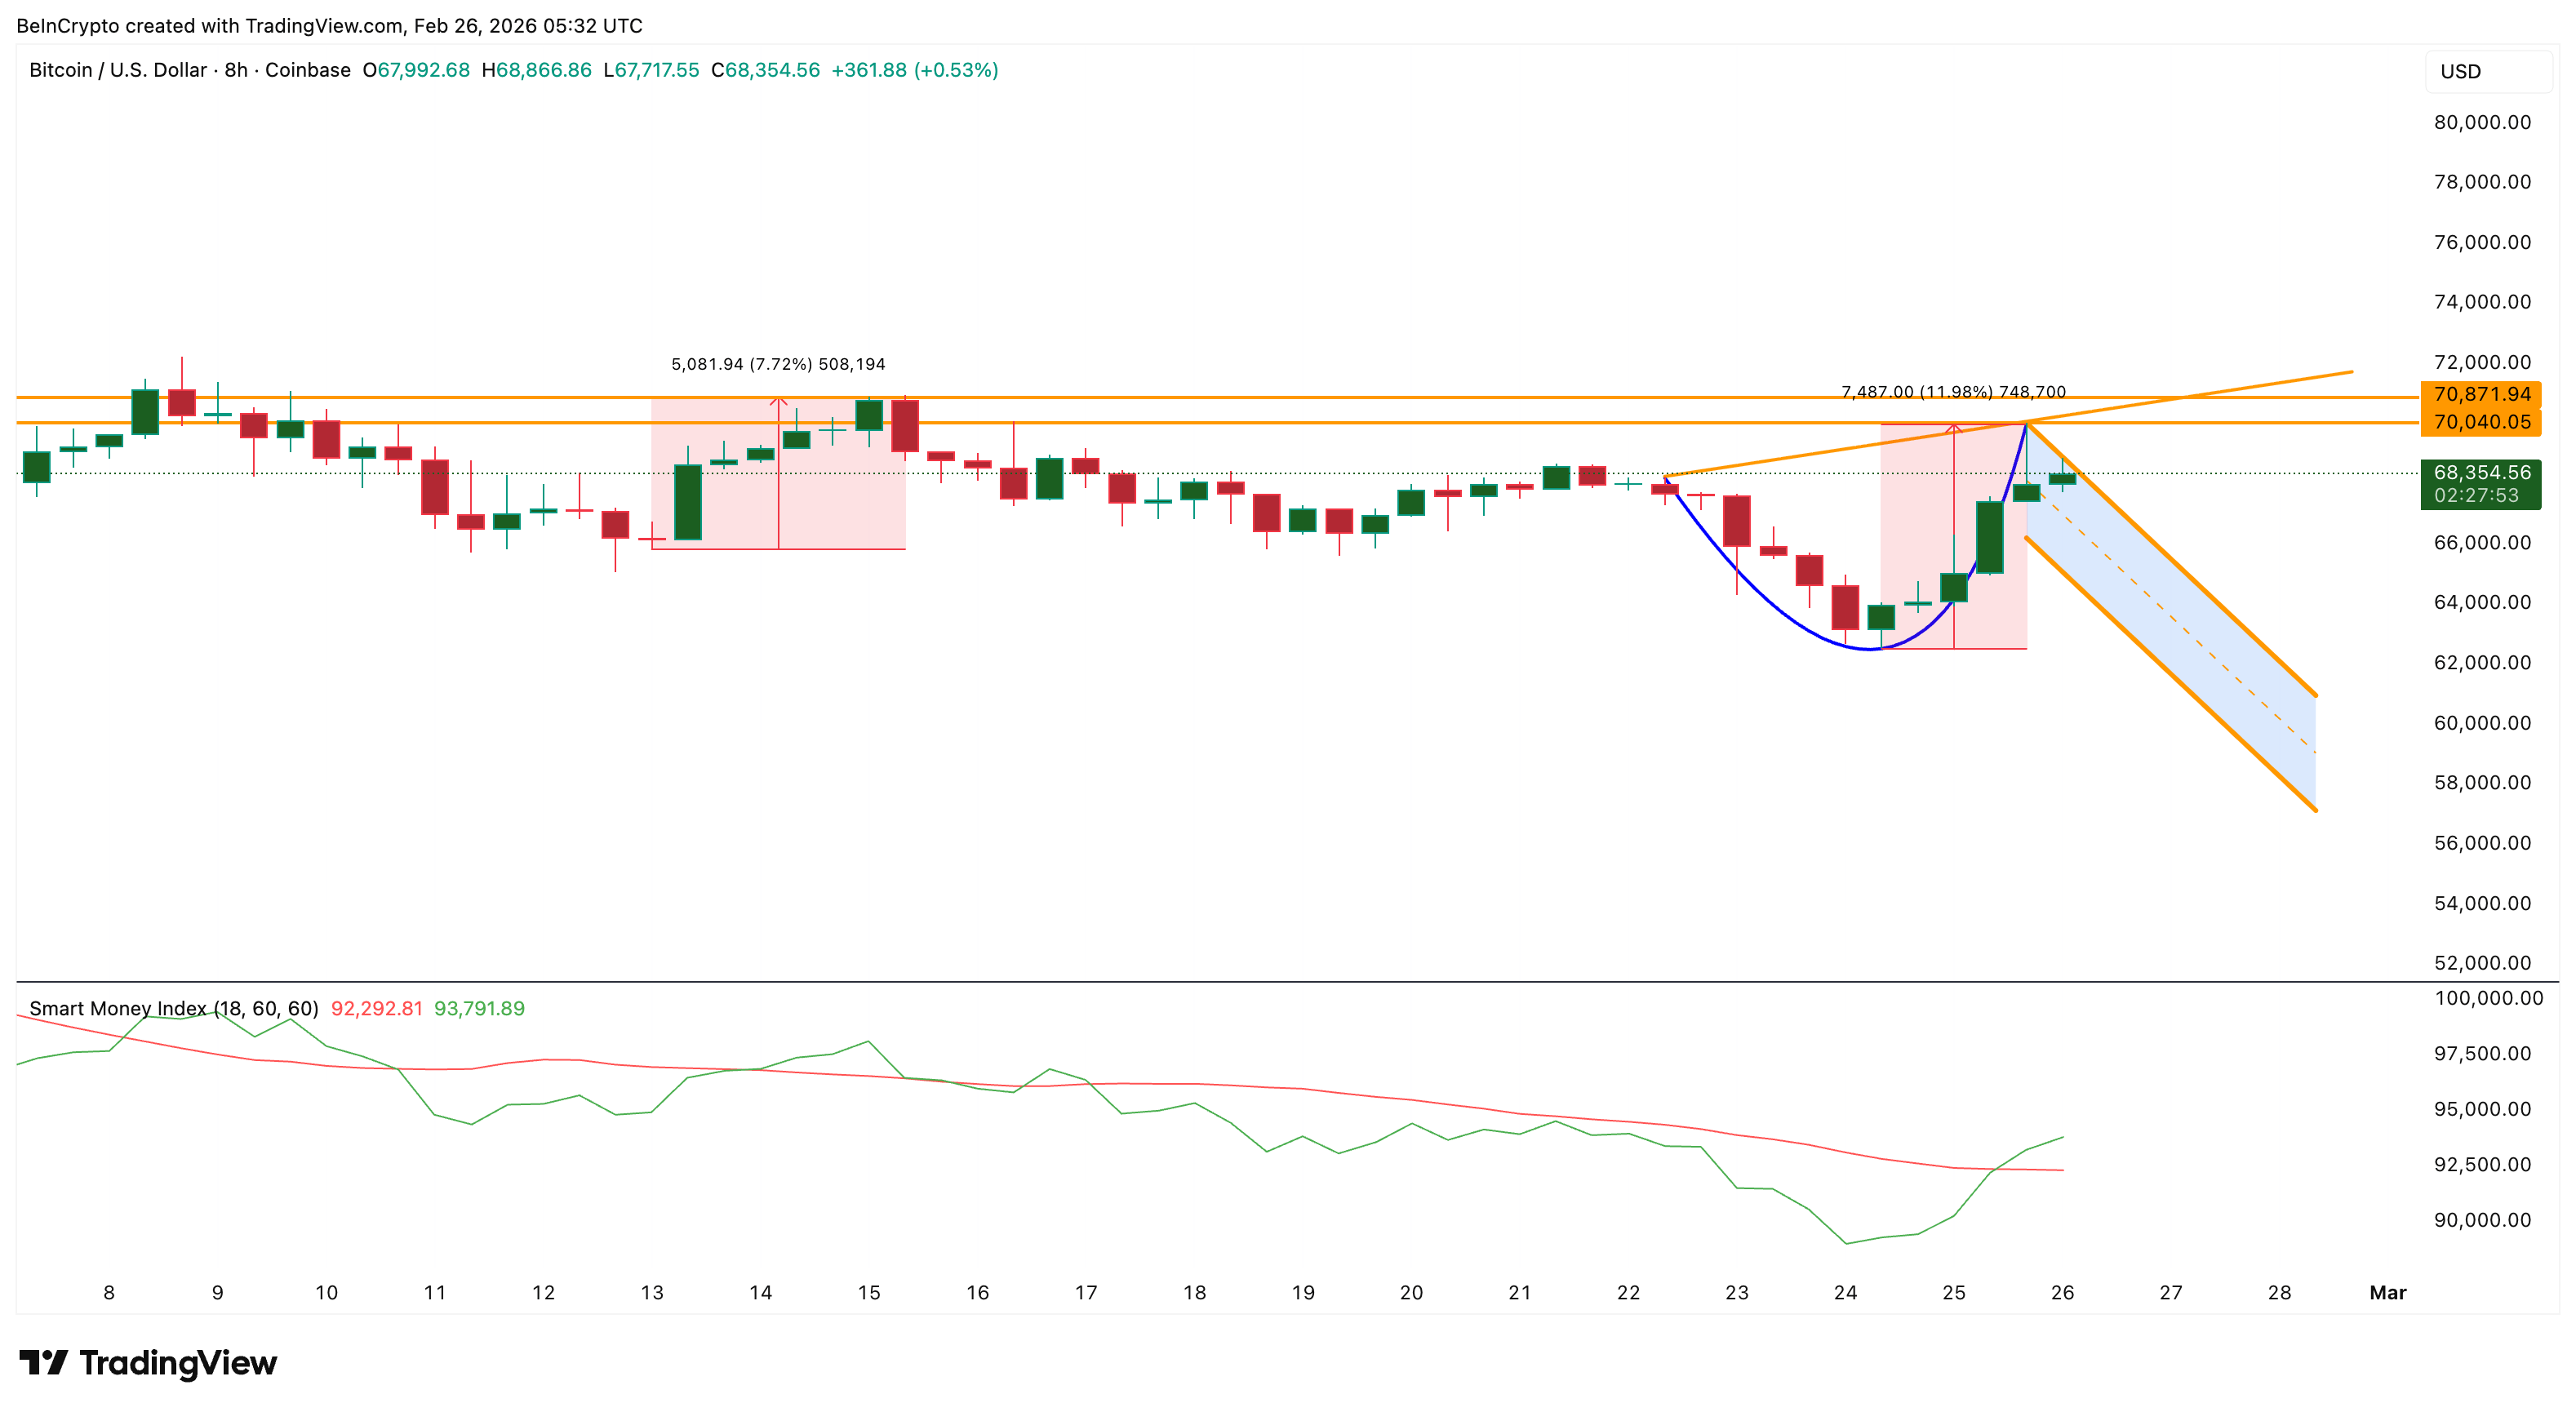
Chart 1: Bitcoin cup and handle pattern forming with resistance at $70,000-70,800 (Source: TradingView)
Technical analysis reveals that Bitcoin is now forming what appears to be a cup and handle pattern—a bullish structure that often precedes significant breakouts. However, the pattern remains unconfirmed because Bitcoin continues to trade below the critical upsloping neckline zone between $70,000 and $70,800.
This range now functions as the trigger level. Until Bitcoin decisively crosses above it, the pattern remains incomplete, and the bullish thesis cannot be validated.
Nexo Analyst Explains Why Bitcoin Price Recovery Still Lacks Conviction
Despite encouraging technical signals, underlying demand metrics tell a more cautious story. Trading volume, a fundamental measure of market participation, reveals significant weakness.
Earlier in February, during the previous price move, Bitcoin trading volume reached $125.5 billion. Today, despite the 12% rebound, volume stands at approximately $52 billion—a decline of more than 58%. This dramatic drop indicates that fewer participants are supporting the current rally, raising questions about its sustainability.
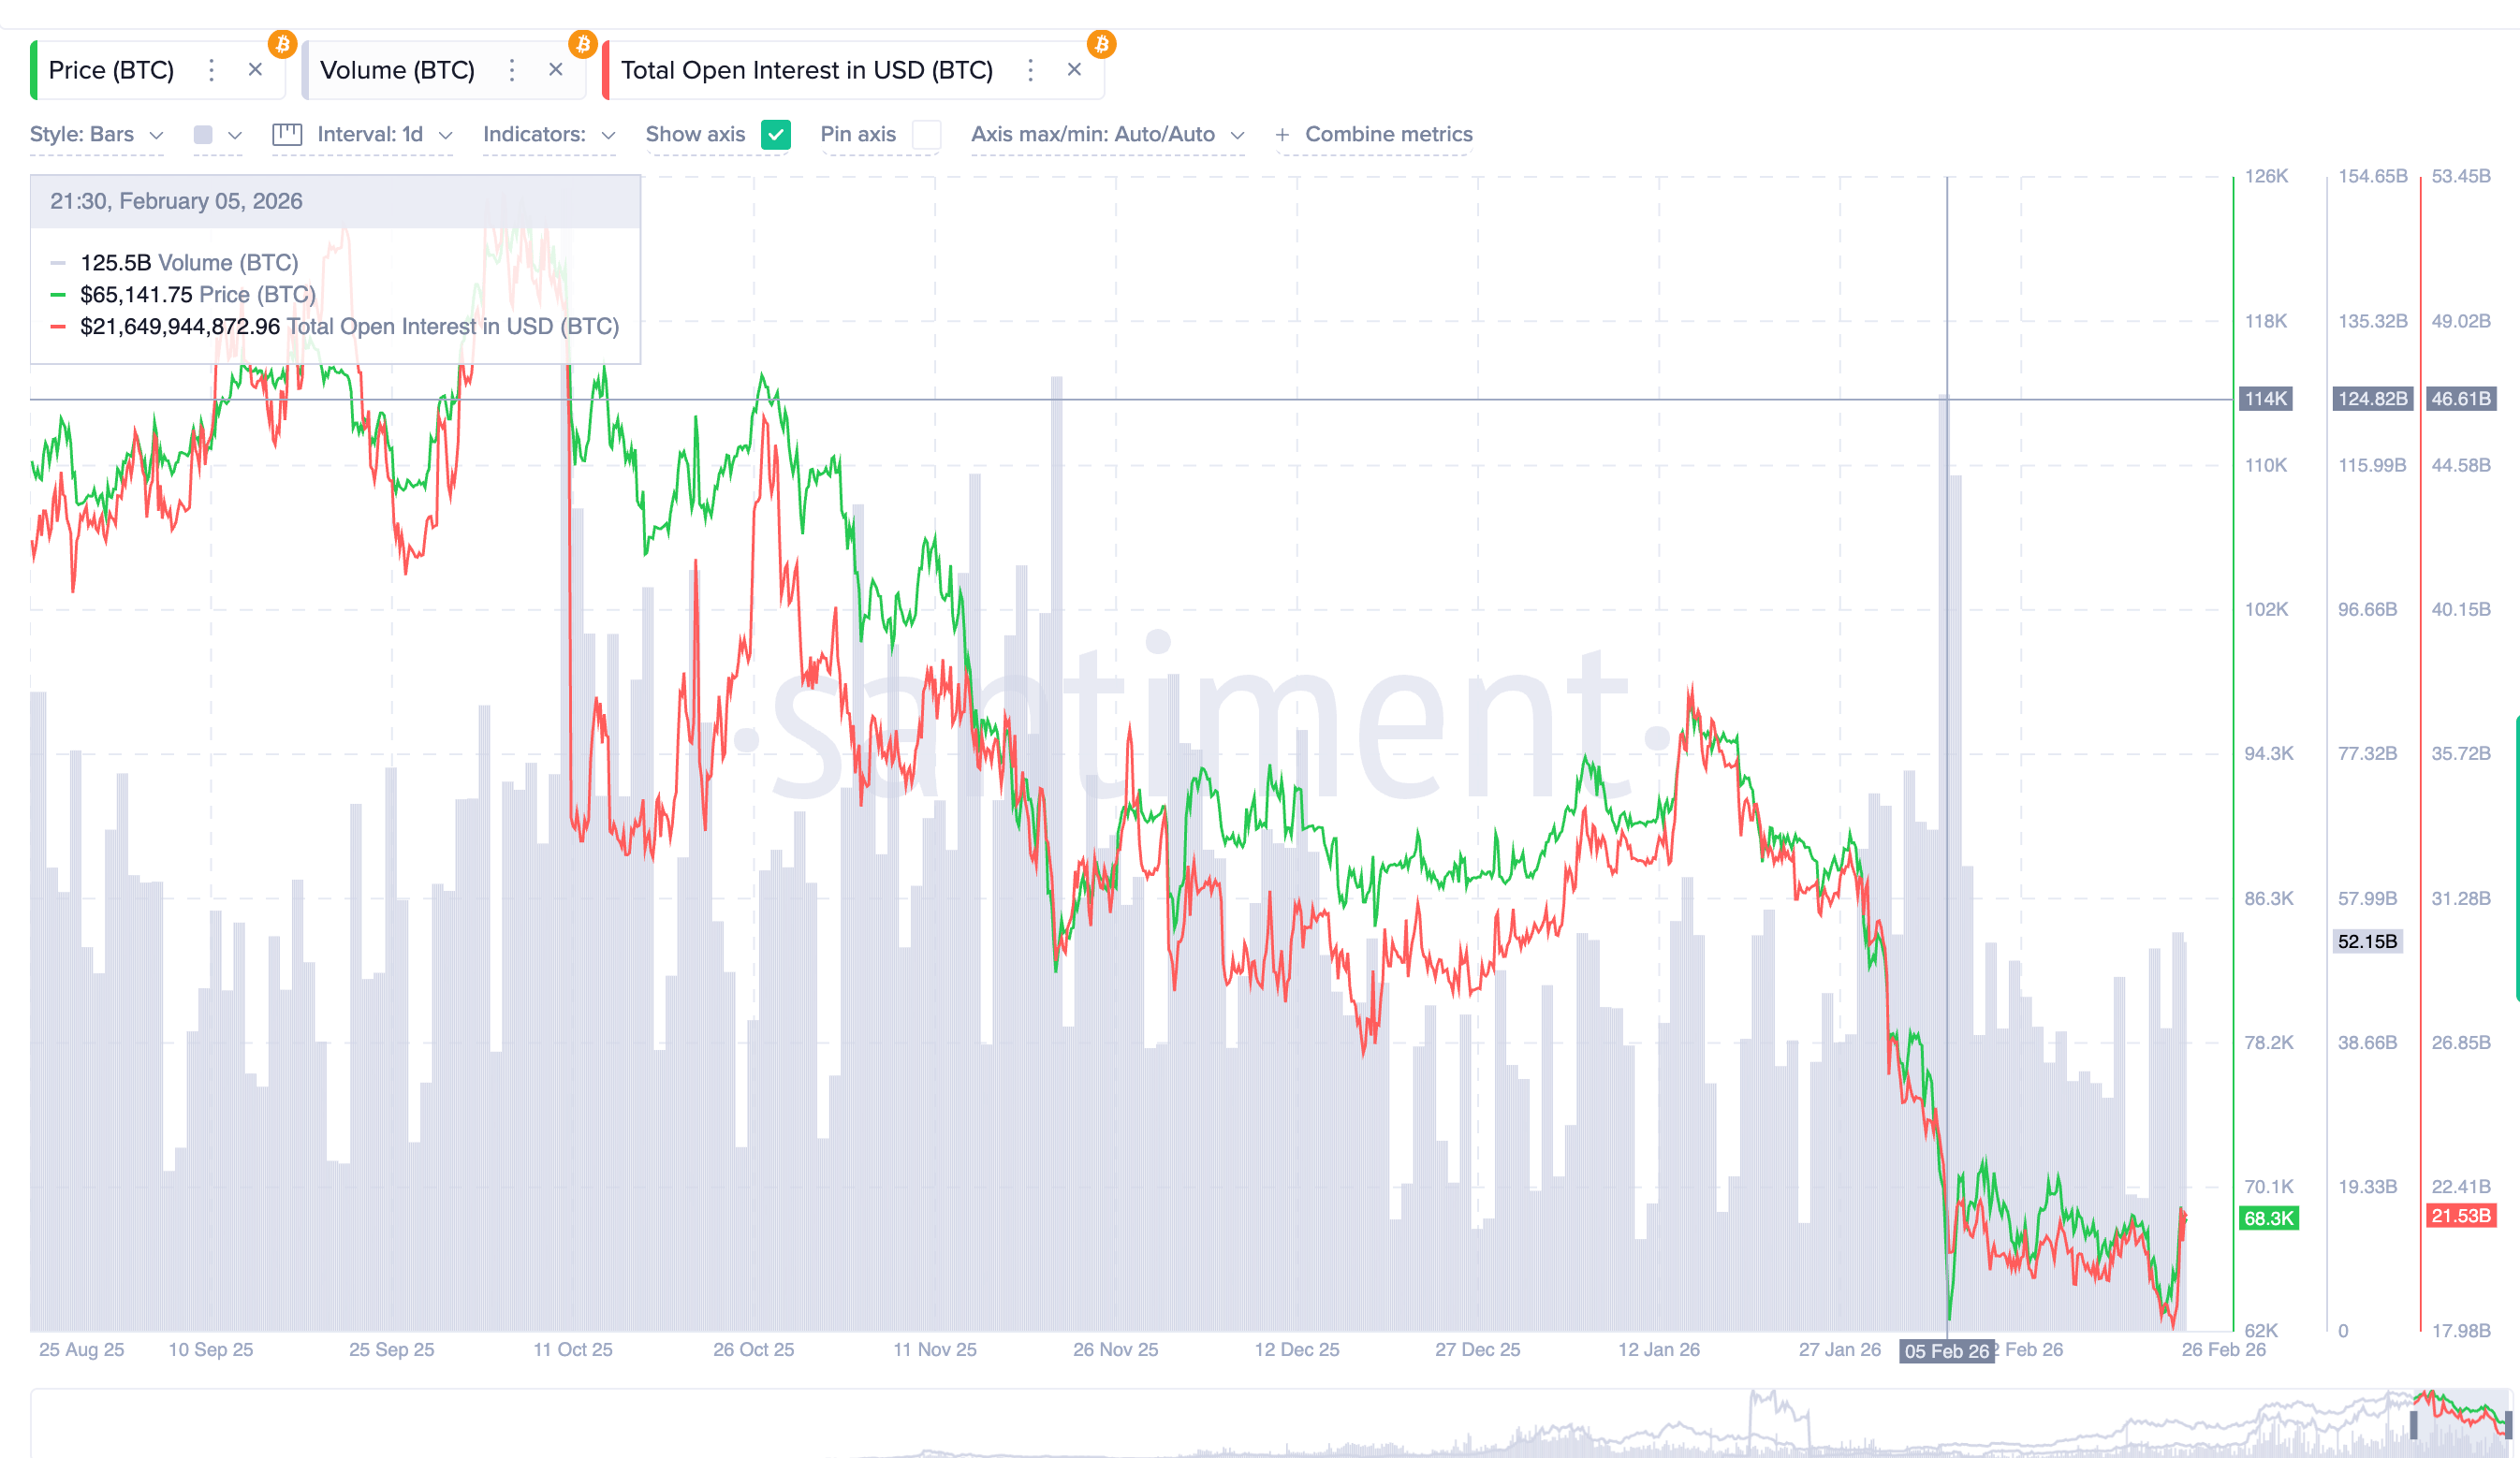
Chart 2: Trading sentiment weakens as volume drops sharply (Source: Santiment)
Dessislava Ianeva from Nexo confirmed this broader participation weakness, stating: “In 2026, BTC average trading volumes are down roughly 17% versus the 2025 average, reflecting subdued market participation.” This context is critical because sustainable price rallies require broad-based participation to maintain momentum.
Open interest—which measures the number of active futures positions—has also contracted sharply. From approximately $37.5 billion in January, open interest has fallen to around $21.5 billion, a 43% decline. This reduction signals that traders are reluctant to establish large directional positions, preferring to remain on the sidelines amid uncertainty.
Ianeva added: “Derivatives positioning has normalized and funding conditions have cooled, pointing to orderly deleveraging rather than systemic stress.” While this stabilization is healthy, it also confirms the absence of aggressive buying pressure typically required for sustained breakouts above major resistance levels.
Long-Term Bitcoin Holders Are Still Selling Despite the Price Bounce
Perhaps the most concerning signal comes from Bitcoin’s long-term holders—investors traditionally considered the “strongest hands” who accumulate during downturns and distribute during market tops.
The Long-Term Holder Net Position Change metric, which tracks whether these investors are accumulating or selling over 30-day periods, reveals continued distribution. On February 24, this metric showed a net reduction of 78,583 BTC. That selling has only marginally slowed to 75,911 BTC recently—still significantly higher than the 61,431 BTC reduction recorded on February 23.
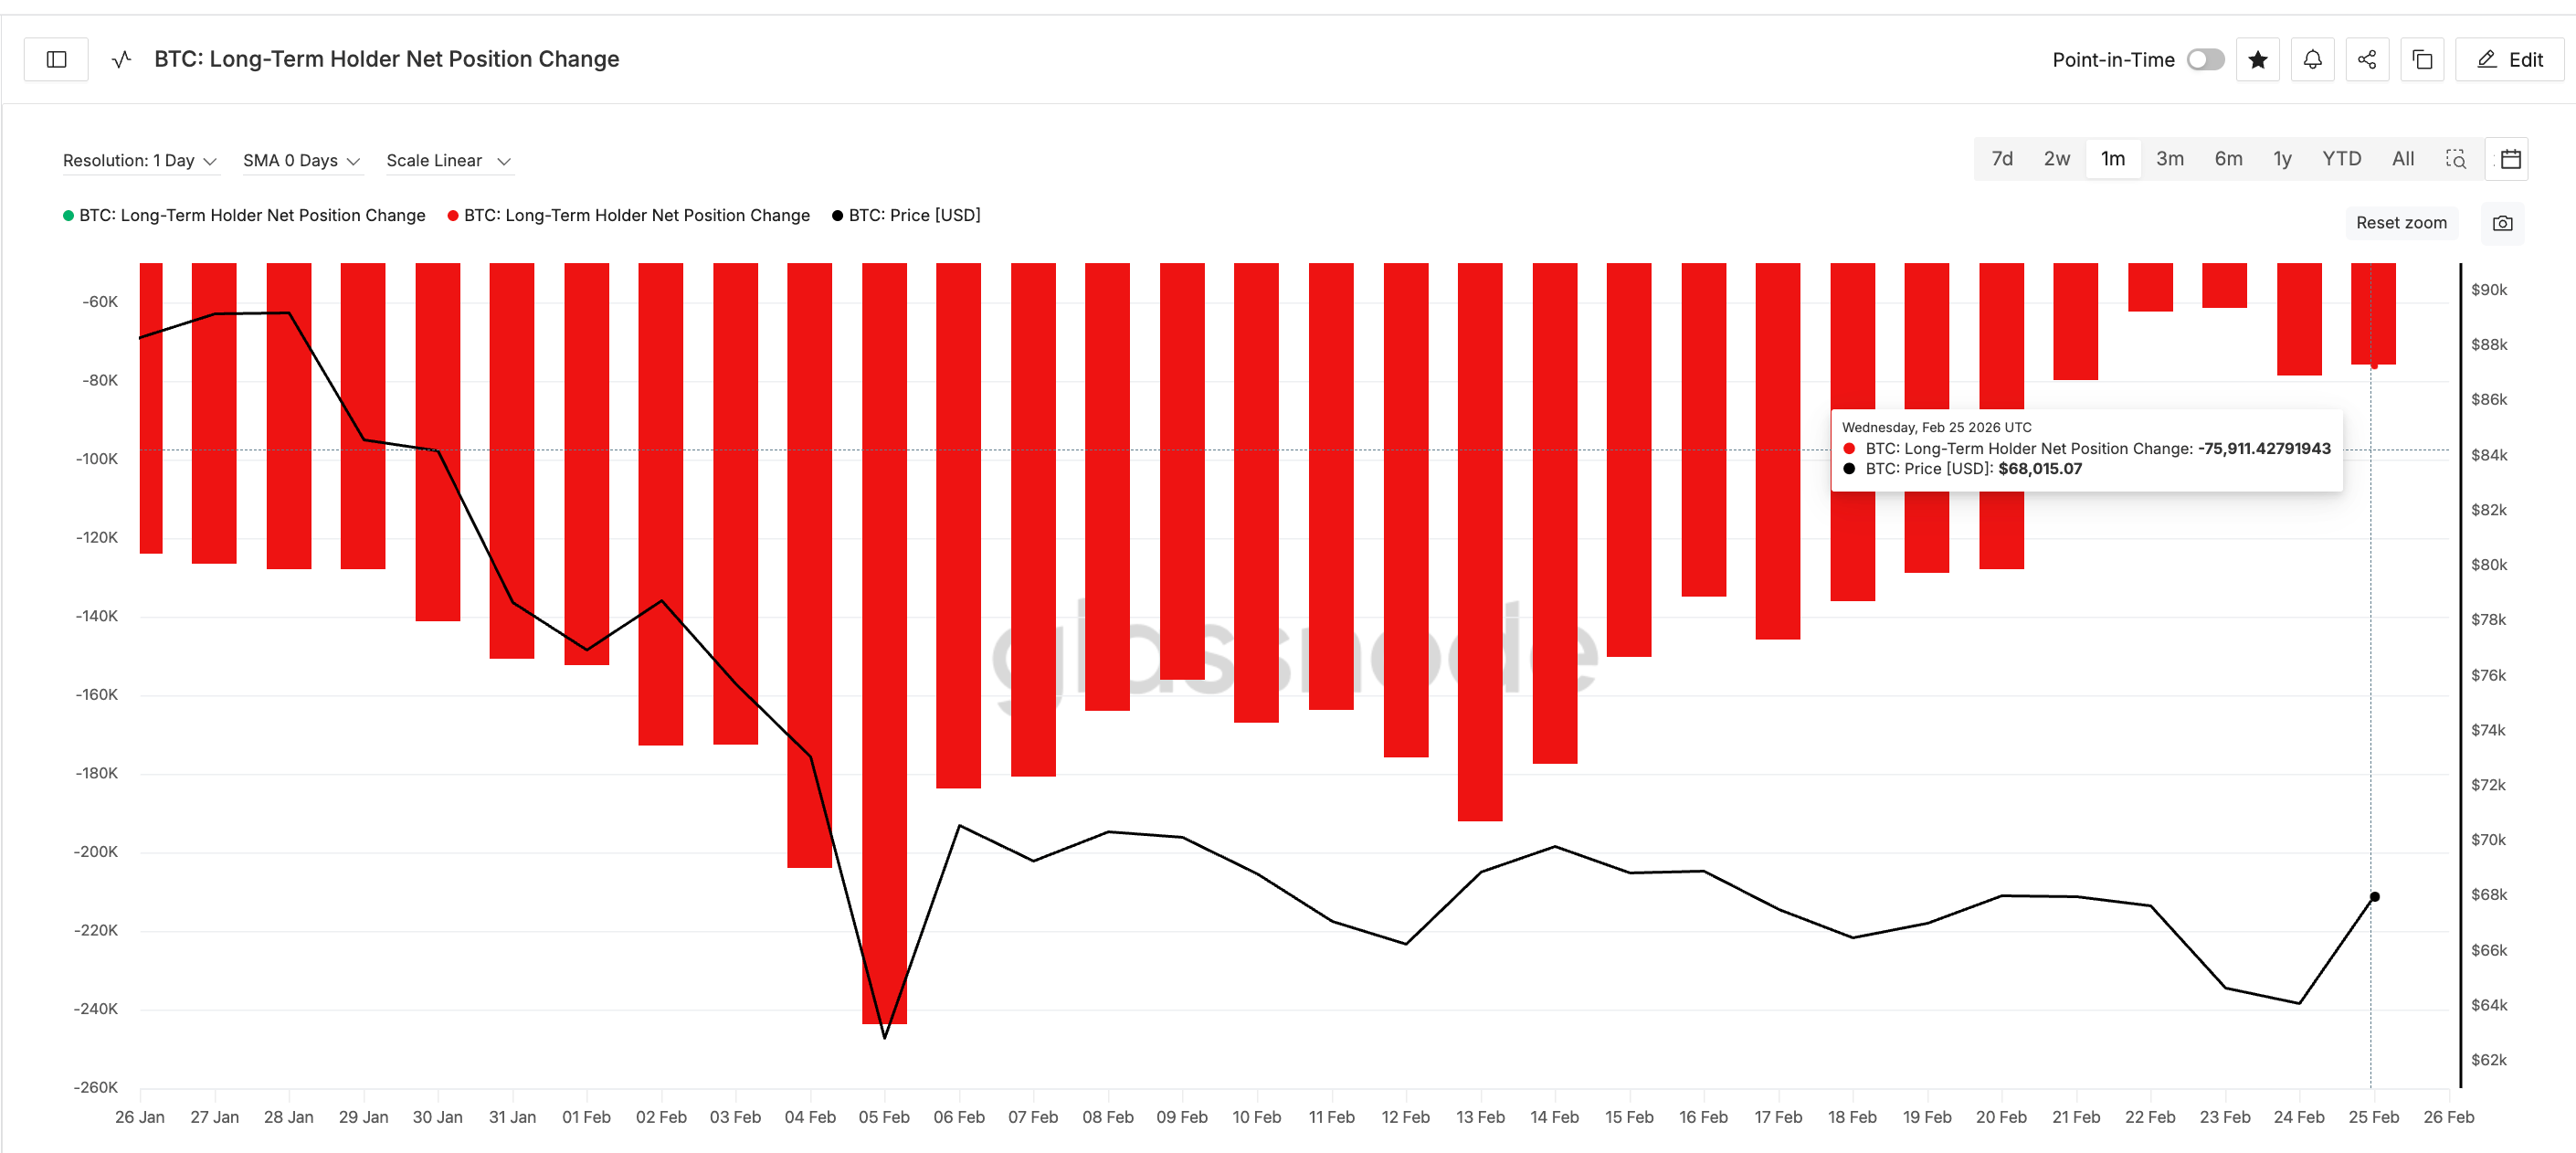
Chart 3: Long-term holders continue selling despite price rebound (Source: Glassnode)
This data reveals that even as Bitcoin recovered nearly 12%, long-term holders did not shift into accumulation mode. Instead, they persisted in distributing supply—behavior inconsistent with the early stages of sustainable bull markets.
Ianeva connected this lack of conviction to broader macroeconomic concerns: “Macro uncertainty continues to constrain liquidity, even as crypto-specific excess has largely been cleared and the market is in a healthier position.”
This assessment confirms that while Bitcoin’s structural health has improved—with excessive leverage largely eliminated—the conviction required for a sustained advance has not fully returned. Until long-term holders cease selling and resume accumulation, upside potential may remain limited, particularly near major resistance zones.
Supply Cluster at $70,000–$70,800 Is the Real Bitcoin Price Barrier
The most concrete explanation for Bitcoin’s hesitation near $70,000 comes from on-chain supply data—specifically the UTXO Realized Price Distribution (URPD), which identifies where investors last acquired their Bitcoin.
Two substantial supply clusters currently occupy this region. The first, near $69,400, contains approximately 0.93% of total supply. The second, at $70,600, holds about 0.60% of supply. Collectively, this zone represents roughly 1.5% of all Bitcoin in circulation—making it one of the most significant resistance levels on the chart.
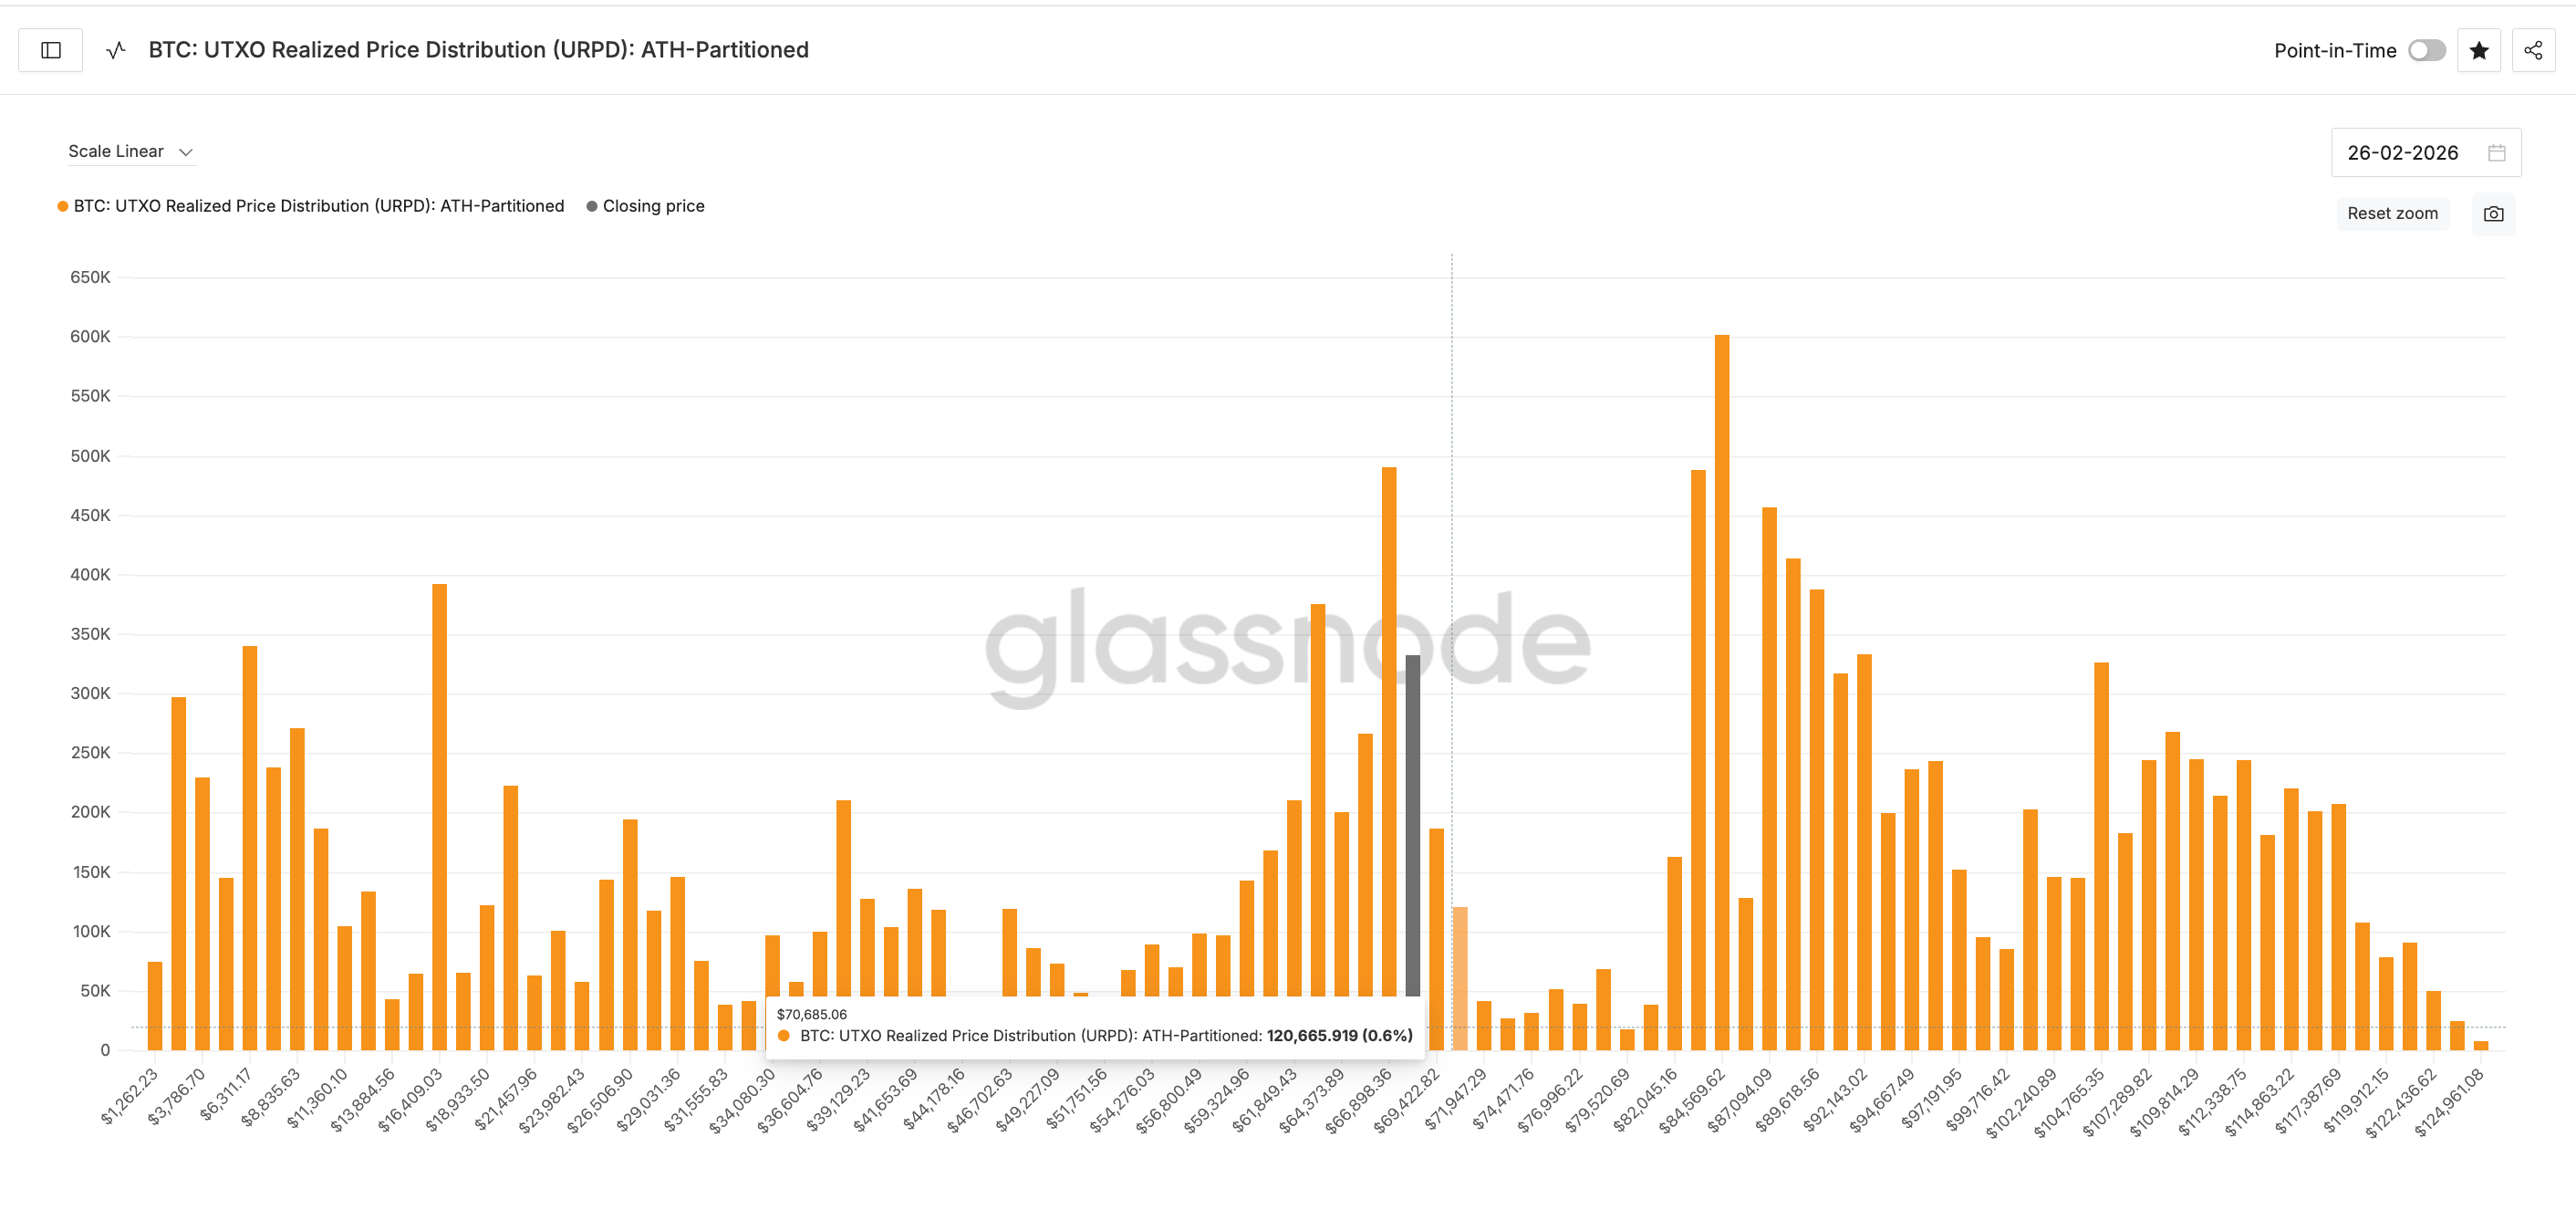
Chart 4: Supply clusters create formidable resistance at $70,000-70,800 (Source: Glassnode)
This supply concentration explains why Bitcoin touched $70,000 but could not sustain trading above it. Investors who purchased at these levels are likely motivated to sell as prices approach their cost basis, creating natural selling pressure that caps advances.
However, this dynamic also clarifies why breaking above $70,800 could trigger a more significant move. Above this level, supply becomes substantially thinner. Once the $70,600 cluster is breached, the next major on-chain resistance sits near $78,200, with relatively clear air in between.
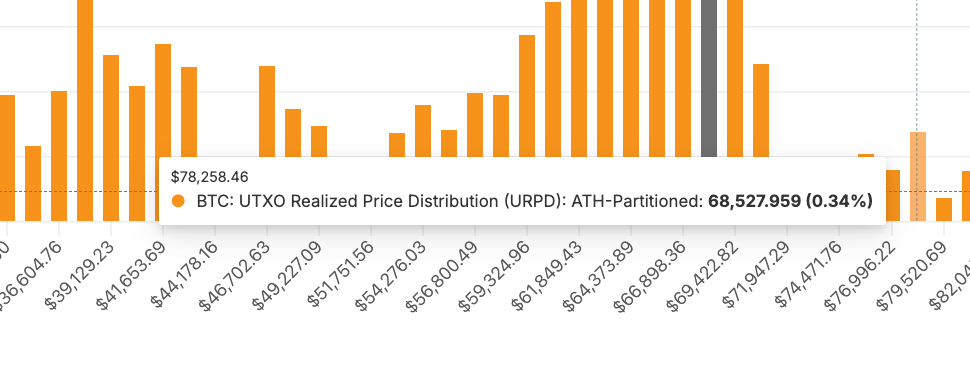
Chart 5: Thinner supply above $70,800 opens path to $78,600 (Source: Glassnode)
The measured move from the cup and handle pattern projects a target near $78,600—approximately 11% above current levels. Notably, this technical projection aligns closely with the on-chain resistance at $78,200, creating a confluence of technical and fundamental evidence.
For this bullish scenario to materialize, Bitcoin must first establish support above $65,700 to maintain the constructive structure. A breakdown below $62,400 would invalidate the cup and handle pattern entirely, signaling that the recovery has failed.
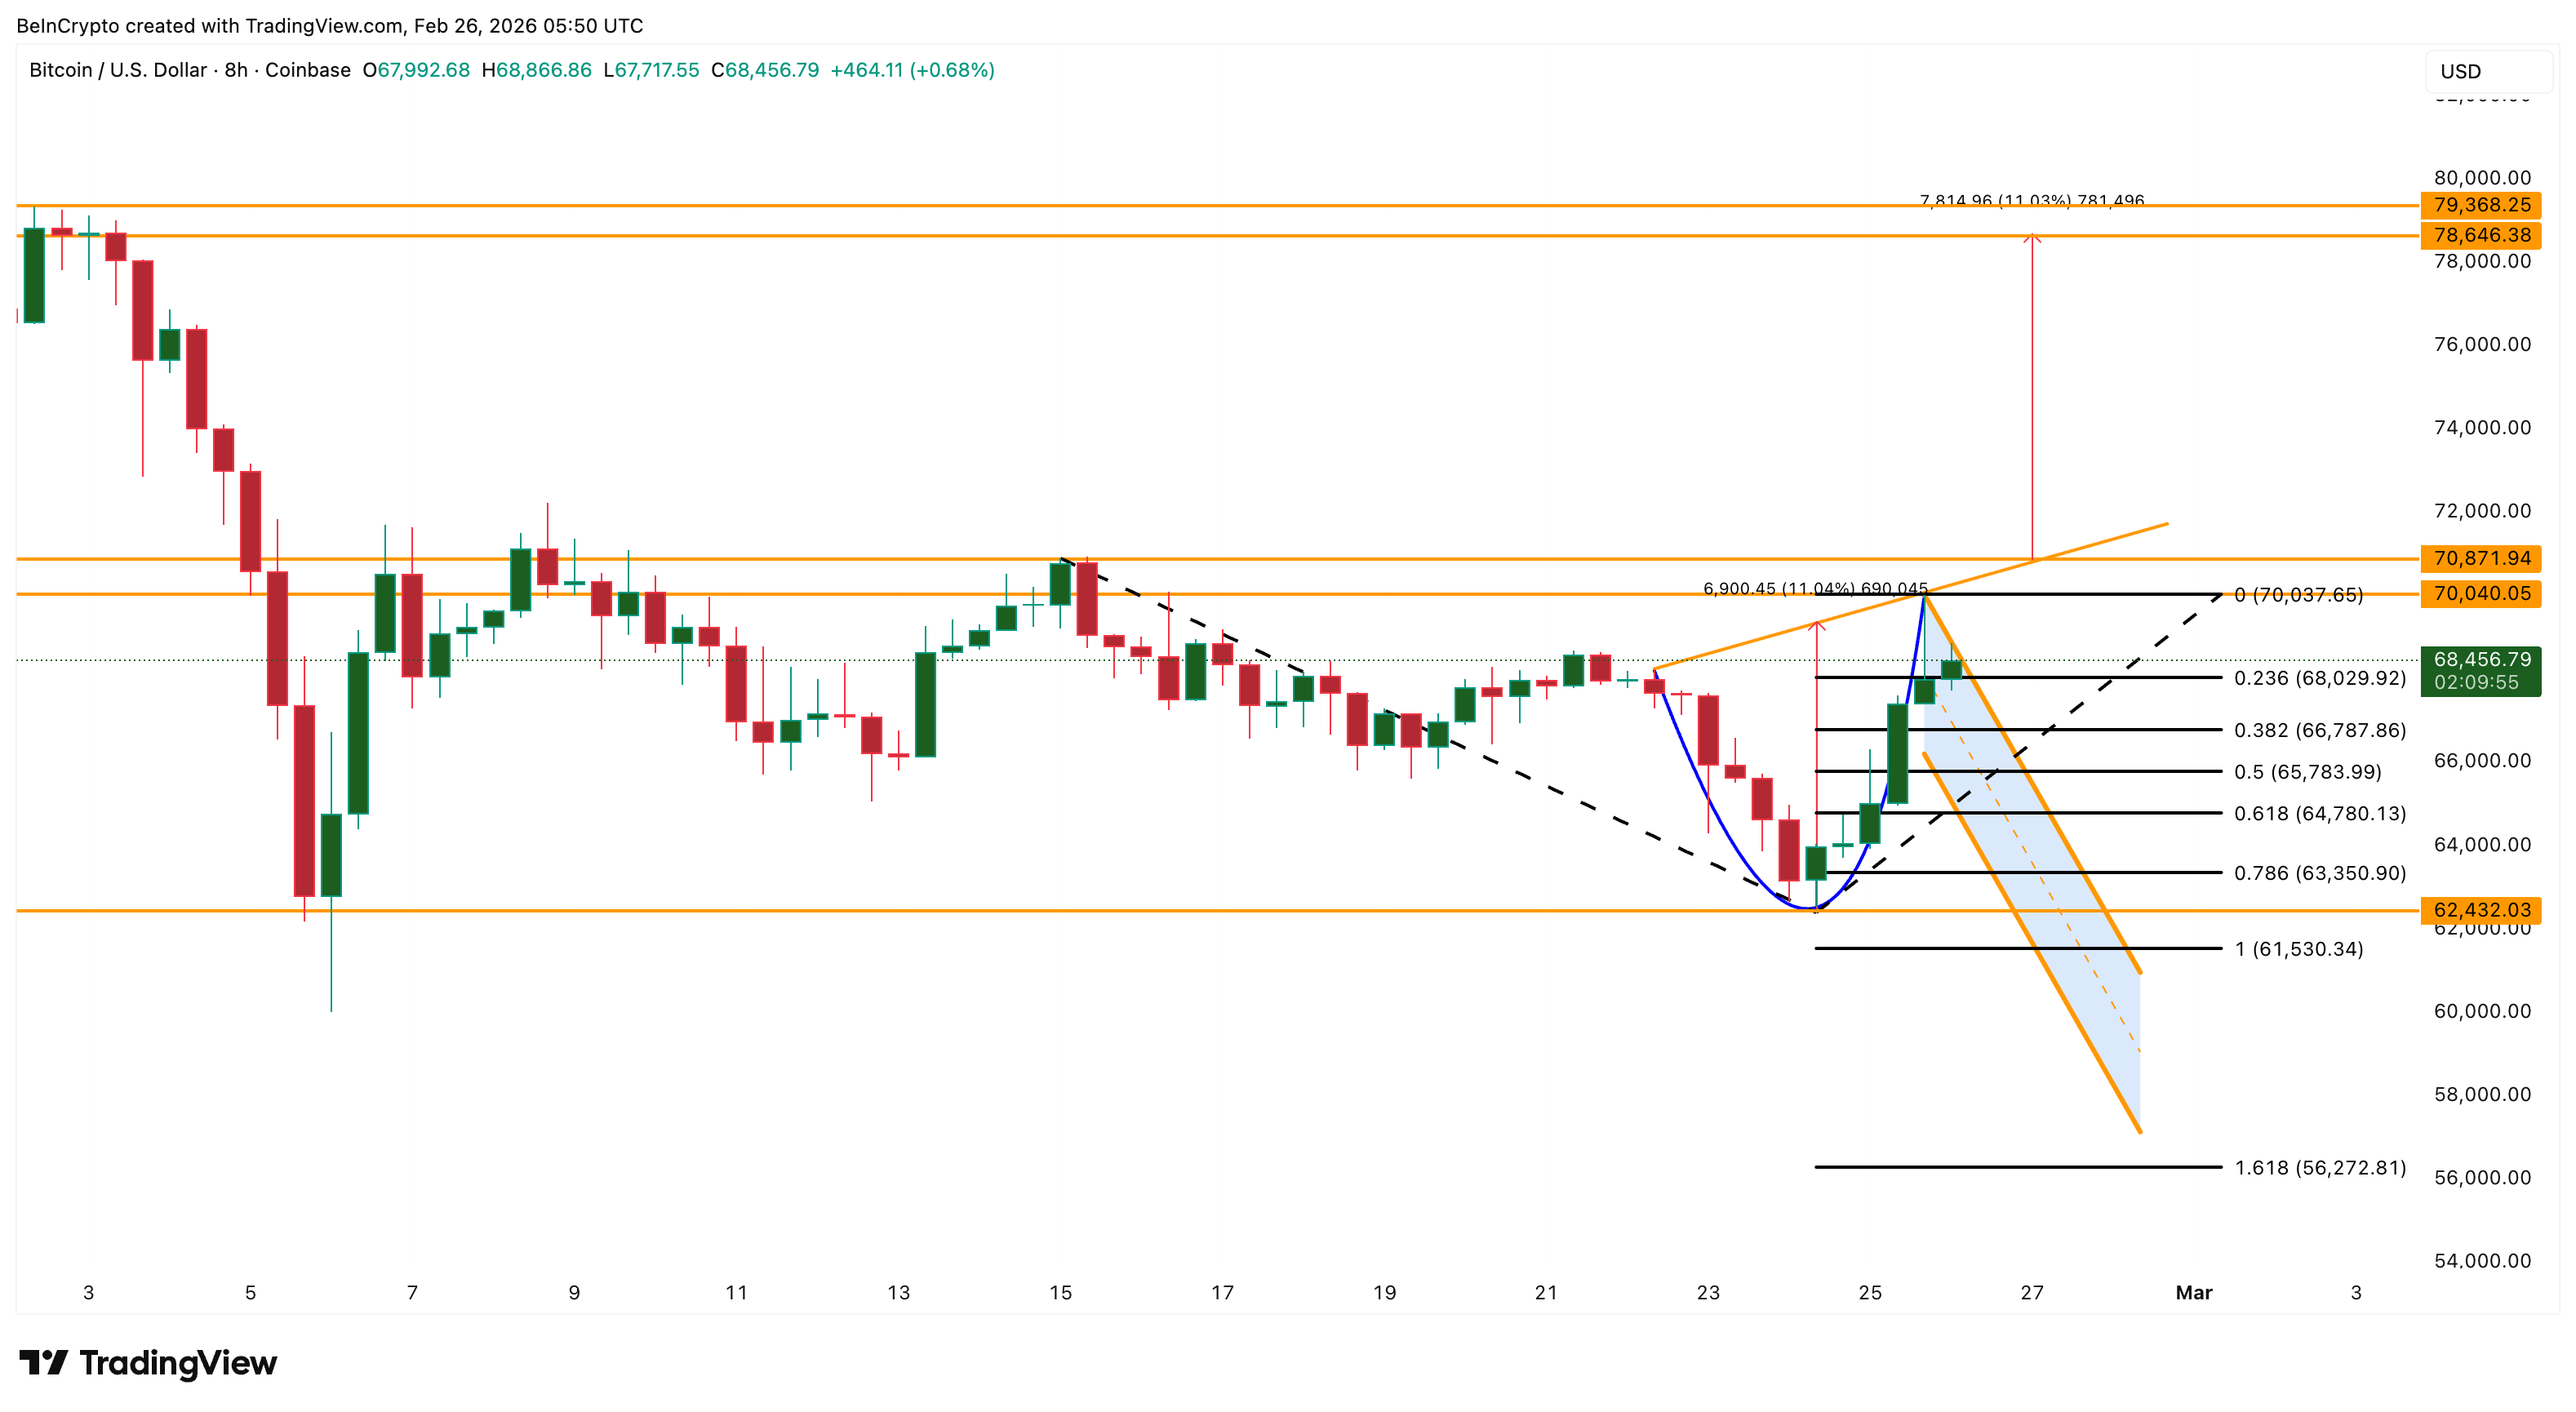
Chart 6: Bitcoin price analysis with key support and resistance levels (Source: TradingView)
Conclusion: Bitcoin at a Critical Decision Point
Bitcoin currently sits at a pivotal juncture. Smart money signals indicate early positioning by informed traders, and the developing cup and handle pattern offers technical hope for bulls. However, declining trading volume, falling open interest, continued distribution by long-term holders, and formidable supply resistance at $70,000-$70,800 collectively argue that conviction remains insufficient for a decisive breakout.
As Nexo analyst Dessislava Ianeva summarized, market structure is improving, but conviction has not fully returned. The coming days will reveal whether Bitcoin can gather sufficient momentum to clear the critical resistance zone, or whether the weight of supply and weak participation forces another retracement. For now, the $70,000 level stands as both a psychological barrier and a technical battleground—one that will likely determine Bitcoin’s direction for weeks to come.
Sources: Nexo / TradingView / Santiment / Glassnode / Market data
Disclaimer: This content is for market information only and is not investment advice.

