
Coin Newsweek – March 4, 2026 – In a market where most assets are struggling to find direction, Bitcoin is quietly building a case for a sustained recovery. Over the past seven days, BTC has gained approximately 3.5%, demonstrating resilience in the face of macro headwinds that would typically pressure risk assets. Meanwhile, gold—the traditional safe-haven during geopolitical stress—has traded essentially flat for the week at -0.05%.
This divergence is unfolding against a challenging backdrop. The US Dollar Index (DXY) is climbing, and Brent crude oil prices are rising on heightened Middle East tensions. Both factors typically weigh on assets like Bitcoin, yet the leading cryptocurrency is holding its ground while gold stumbles.
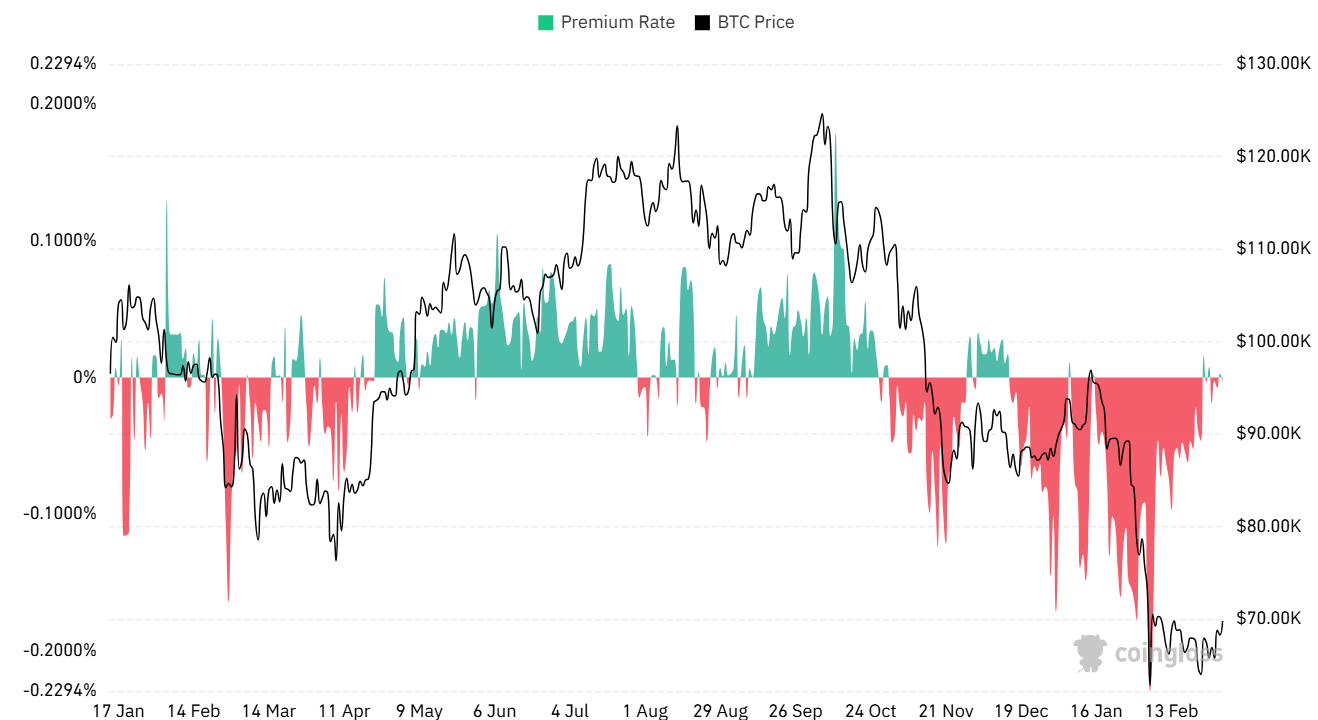
Chart 1: Coinbase Premium Index turns positive after prolonged negative stretch (Source: CoinGlass)
Coinbase Premium Signals Return of US Buying Power
The Coinbase Premium Index, which measures the price difference between Bitcoin on Coinbase and offshore exchanges, has flipped positive for the first time since mid-January. Data from CryptoQuant shows the index registered a reading of +0.00283 on March 2, marking a decisive shift after a nearly 40-day negative stretch that ran from January 15 through February 23.
That prolonged negative period reflected sustained selling pressure from US-based investors and institutions throughout the correction from above $90,000. But the tone began to change in late February. The premium briefly turned positive on February 24, 25, and 26, then dipped before returning positive again on March 2. This pattern suggests US buyers are gradually re-entering the market.
The timing is significant. When the Coinbase premium first flipped positive on February 24, Bitcoin responded with a sharp bounce of nearly 13%, rallying to repeatedly test the $70,000 level. That level has since become a firm resistance, but the underlying demand signal from US buyers remains active—a critical component for any sustained breakout attempt.
Bullish RSI Divergence Keeps Rebound Structure Intact
Adding technical weight to the demand picture is a bullish divergence on the daily Relative Strength Index (RSI). Between January 25 and March 1, Bitcoin’s price printed a lower low while the 14-day RSI formed a higher low—a classic reversal signal that often precedes trend changes.
While price briefly pushed above $70,000 before correcting, the divergence structure remains intact. The RSI continues to trace a higher low trajectory while price maintains lower lows relative to late January, suggesting that momentum is building beneath the surface even as price action remains choppy.
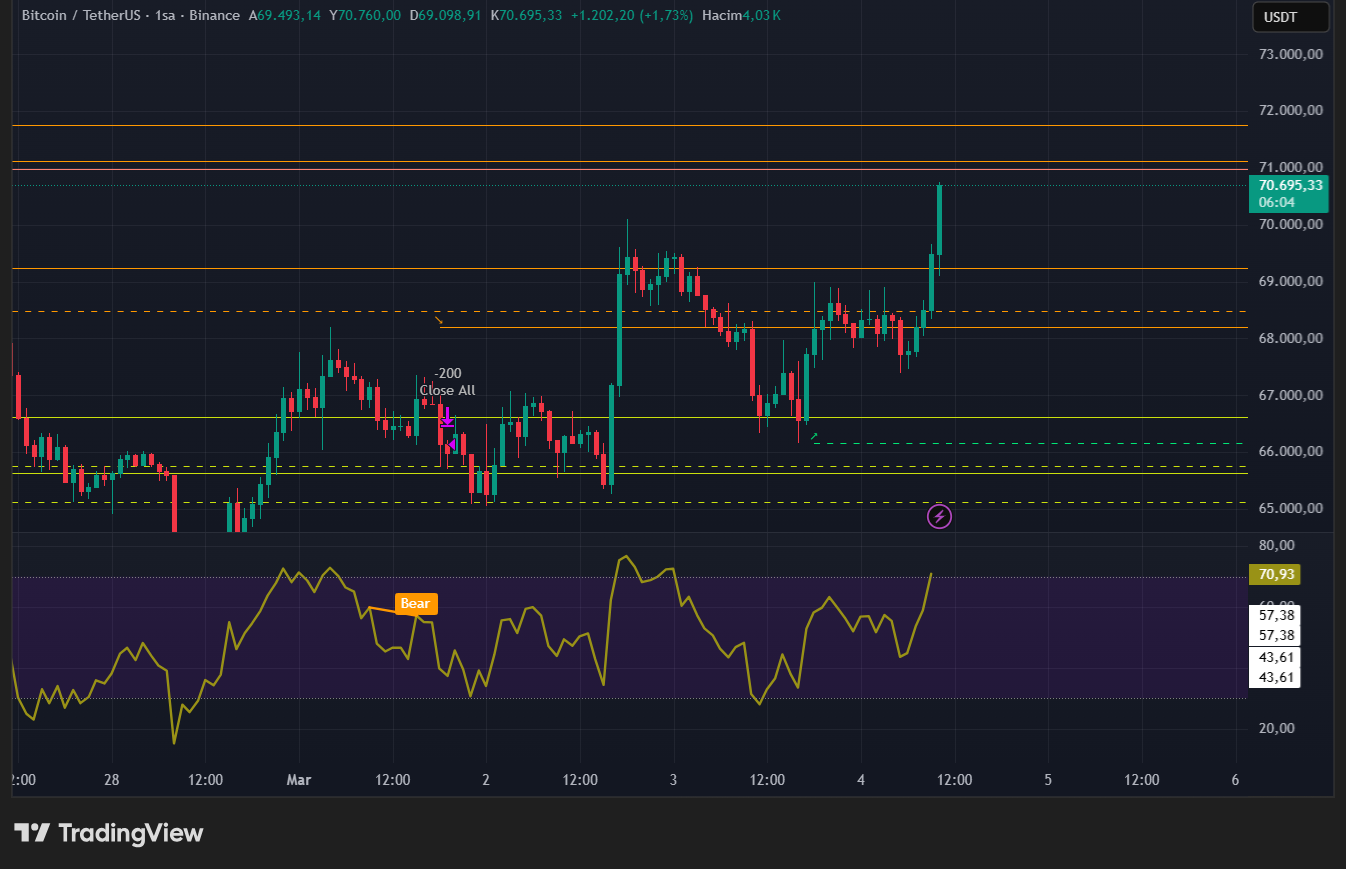
Chart 2: Bullish RSI divergence signals potential trend reversal (Source: TradingView)
With both the Coinbase premium and the RSI divergence active simultaneously, the technical setup for a sustained recovery attempt is becoming increasingly compelling.
Long-Term Holders Return to Accumulation Mode
The demand signal extends beyond US spot buyers. Glassnode data on Bitcoin’s Hodler Net Position Change—which tracks accumulation by wallets holding BTC for 155 days or more—shows a dramatic surge in mid-to-long-term holder activity.
On February 6, when Bitcoin was trading above $70,500, the 155-day+ hodler net position change stood at 3,399 BTC, indicating modest accumulation. By March 3, with Bitcoin at a slightly lower price of $68,300, that figure had surged to 27,225 BTC—an increase of roughly eight times at a lower price level.
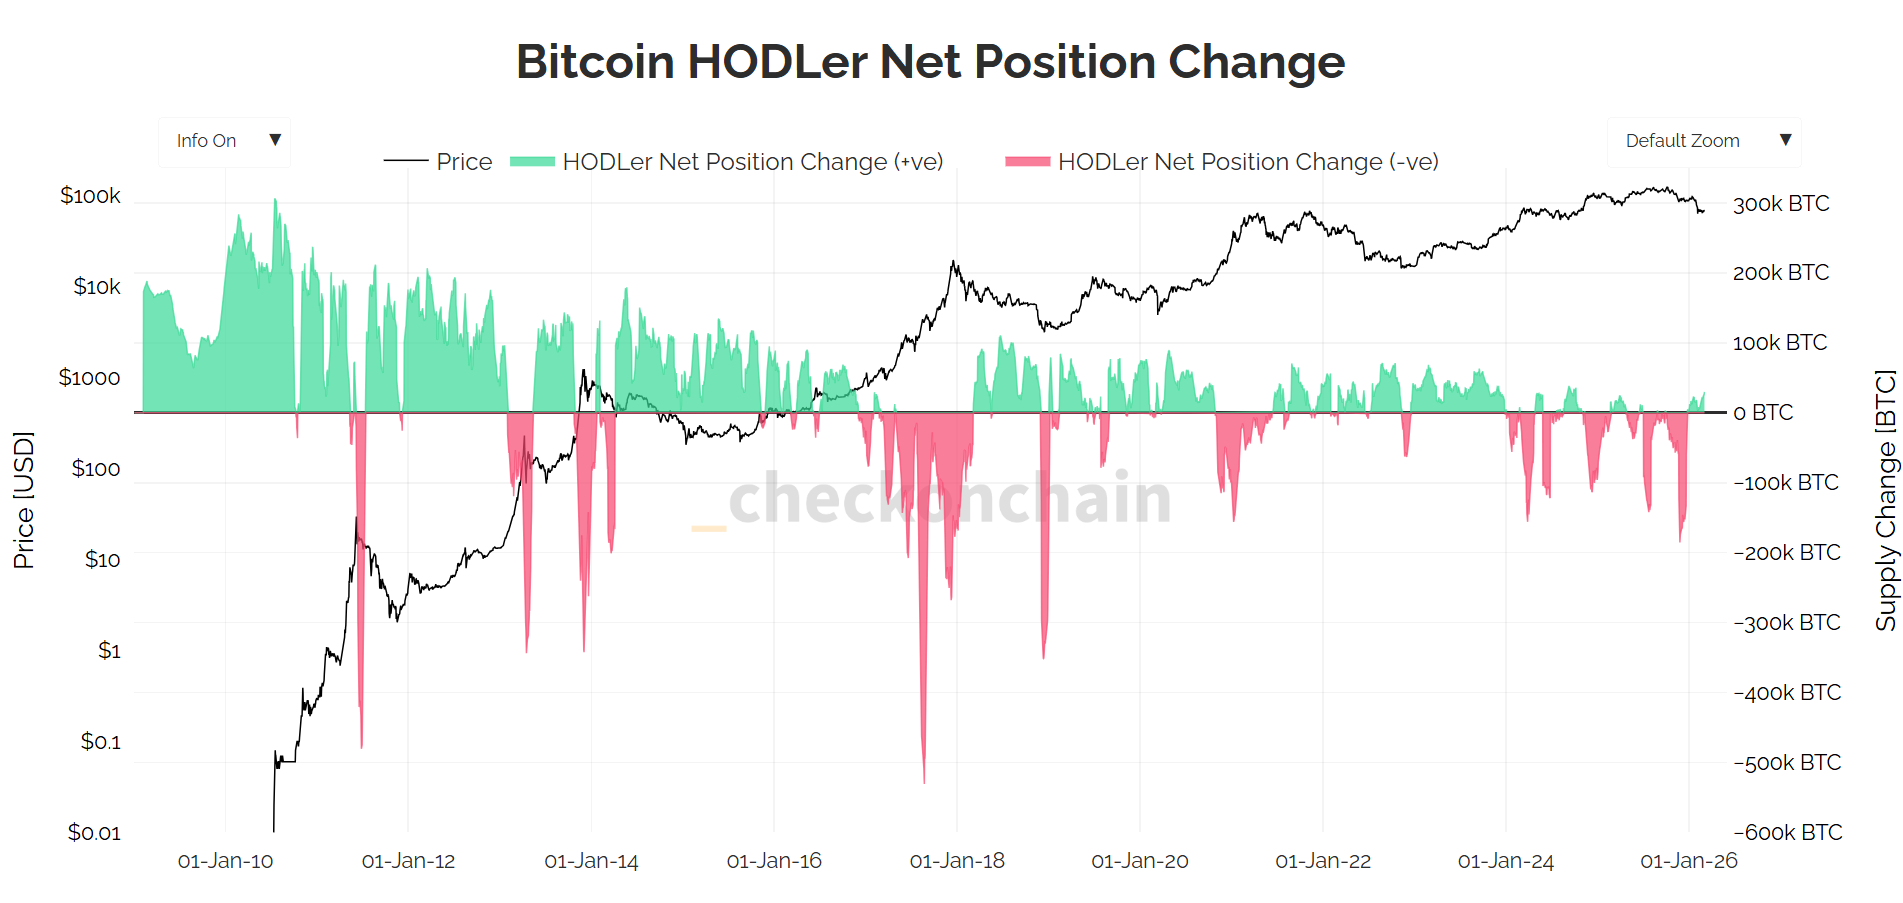
Chart 3: Long-term holder accumulation surges eightfold (Source: checkonchain)
This is significant because it shows conviction among sophisticated investors is increasing even as short-term price action remains uncertain. Wallets holding for 155 days or more are making a deliberate decision to add at current levels, viewing the $67,000–$70,000 range as an accumulation zone rather than a distribution zone.
Combined with the returning Coinbase premium, demand is building across two distinct cohorts: US spot buyers and longer-duration holders. Both are stepping in during a period of elevated macro uncertainty, suggesting conviction that may prove resilient.
Gold Stumbles While Bitcoin Holds Firm
The divergence between Bitcoin and gold adds another layer to the narrative. Gold, which dominated the safe-haven narrative throughout 2025 and into 2026, is faltering precisely when Bitcoin is holding firm. XAU/USD surged above $5,400 a few sessions back but has since corrected roughly 8%, briefly dipping below the psychological $5,000 level before recovering to trade near $5,170.
Gold’s weekly performance sits at -0.05%, essentially flat. This stall comes despite a macro backdrop that should theoretically support the yellow metal: Brent crude oil has risen above $78 on geopolitical tensions, feeding inflation expectations and supporting the dollar, yet gold has corrected rather than rallied.
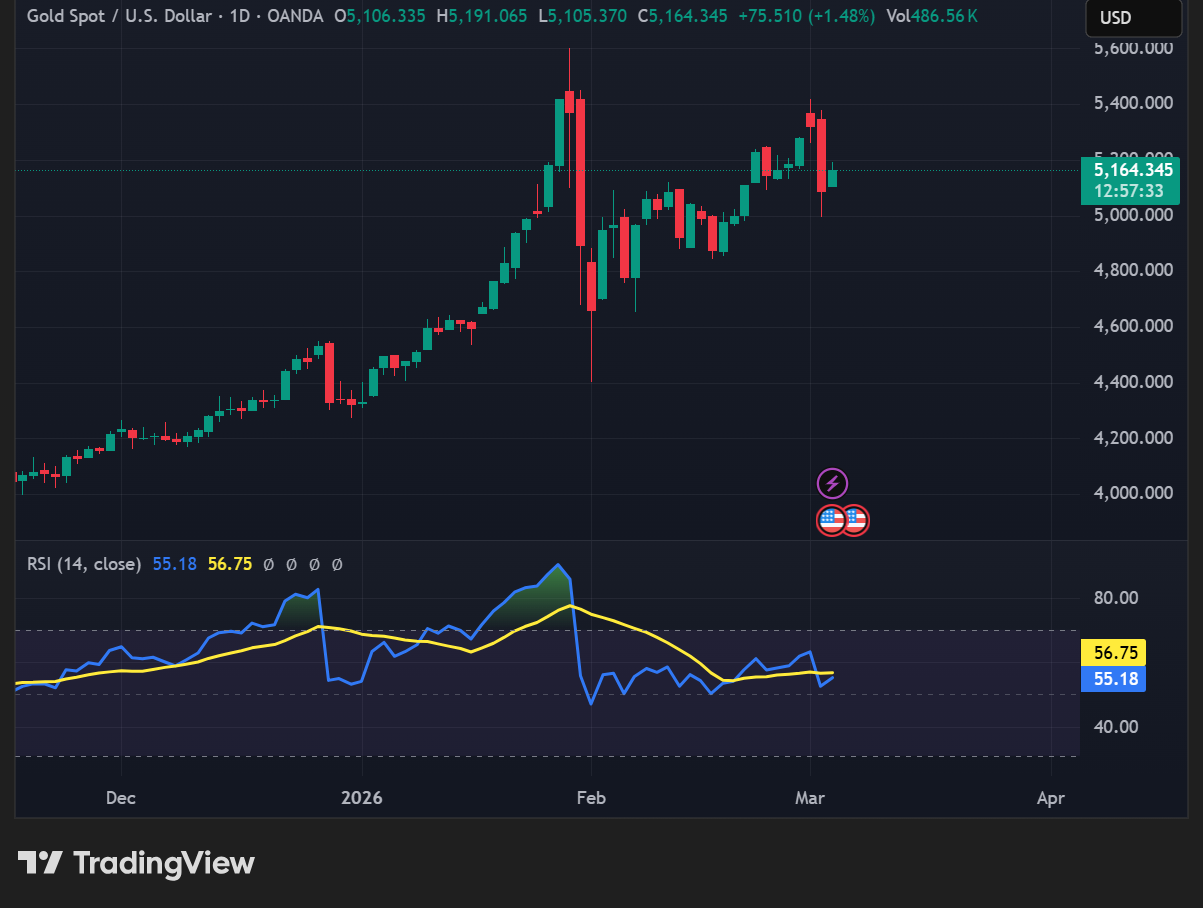
Chart 4: Gold corrects 8% from recent highs despite geopolitical tailwinds (Source: TradingView)
The DXY has climbed to 99.076 in response to rising oil and shifting rate expectations. A stronger dollar is typically bearish for both gold and Bitcoin. Yet Bitcoin is absorbing the pressure in a way gold currently is not, gaining 3.5% on the week while the traditional safe-haven stalls.
This divergence raises an important question: are we witnessing a structural rotation from gold into Bitcoin? Whether it reflects a lasting shift in safe-haven preferences or simply different demand dynamics, the data is clear. US buying demand is returning to BTC, long-term holders are accumulating aggressively, and the daily rebound structure remains intact. Gold, despite geopolitical tailwinds, has been unable to sustain its rally.
The $70,000 Barrier: Make or Break for Bitcoin
With demand-side fundamentals strengthening, Bitcoin’s price structure now points to $70,000 as the decisive level. Based on Fibonacci extensions drawn from the February 6 low, the $70,000–$70,100 zone aligns with the 0.618 Fib level. This has been the ceiling that every rally attempt has hit since mid-February.
Bitcoin bounced sharply off the lows, pushed above $70,000 briefly, but could not secure a daily close above this zone. The repeated rejections have reinforced its significance as technical resistance.

Chart 5: Bitcoin price analysis with key Fibonacci levels (Source: TradingView)
If Bitcoin manages a daily close above $70,100, it opens the path toward $72,200 (0.786 Fib) and could potentially recover to $74,900 (1.0 extension). On the downside, $67,200 (0.382 Fib) serves as the nearest crucial support. A break below this exposes $65,400 (0.236 Fib).
The more critical structural level sits at $62,400, marking the base of the current Fibonacci range. A confirmed break below $62,400 would open the door toward $60,100 and invalidate the bullish setup that has been building.
What Comes Next for Bitcoin?
The convergence of positive signals is difficult to ignore. Returning US demand through the Coinbase premium, surging long-term holder accumulation, an intact RSI divergence, and Bitcoin’s relative strength against gold all point to a market that is building momentum beneath the surface.
The $70,000 barrier remains the final test. A decisive breakout above this level could shift Bitcoin’s narrative from mere resilience to the beginning of a sustained recovery. It would signal that the accumulation of the past weeks was strategic positioning rather than wishful thinking, and that buyers are finally willing to chase price higher.
Conversely, failure to clear $70,000 would extend the range-bound consolidation that has characterized recent months. It would suggest that despite growing demand, sellers remain entrenched at this psychologically important level, and that more time may be needed to absorb supply.
For now, the evidence favors the bulls. Demand is returning, conviction is building, and Bitcoin is outperforming traditional safe havens in an environment that should theoretically favor them. Whether this translates into a $70,000 breakout will likely determine the market’s direction for weeks to come.
Sources: CryptoQuant / Glassnode / TradingView / Investing.com
Disclaimer: This content is for market information only and is not investment advice.

