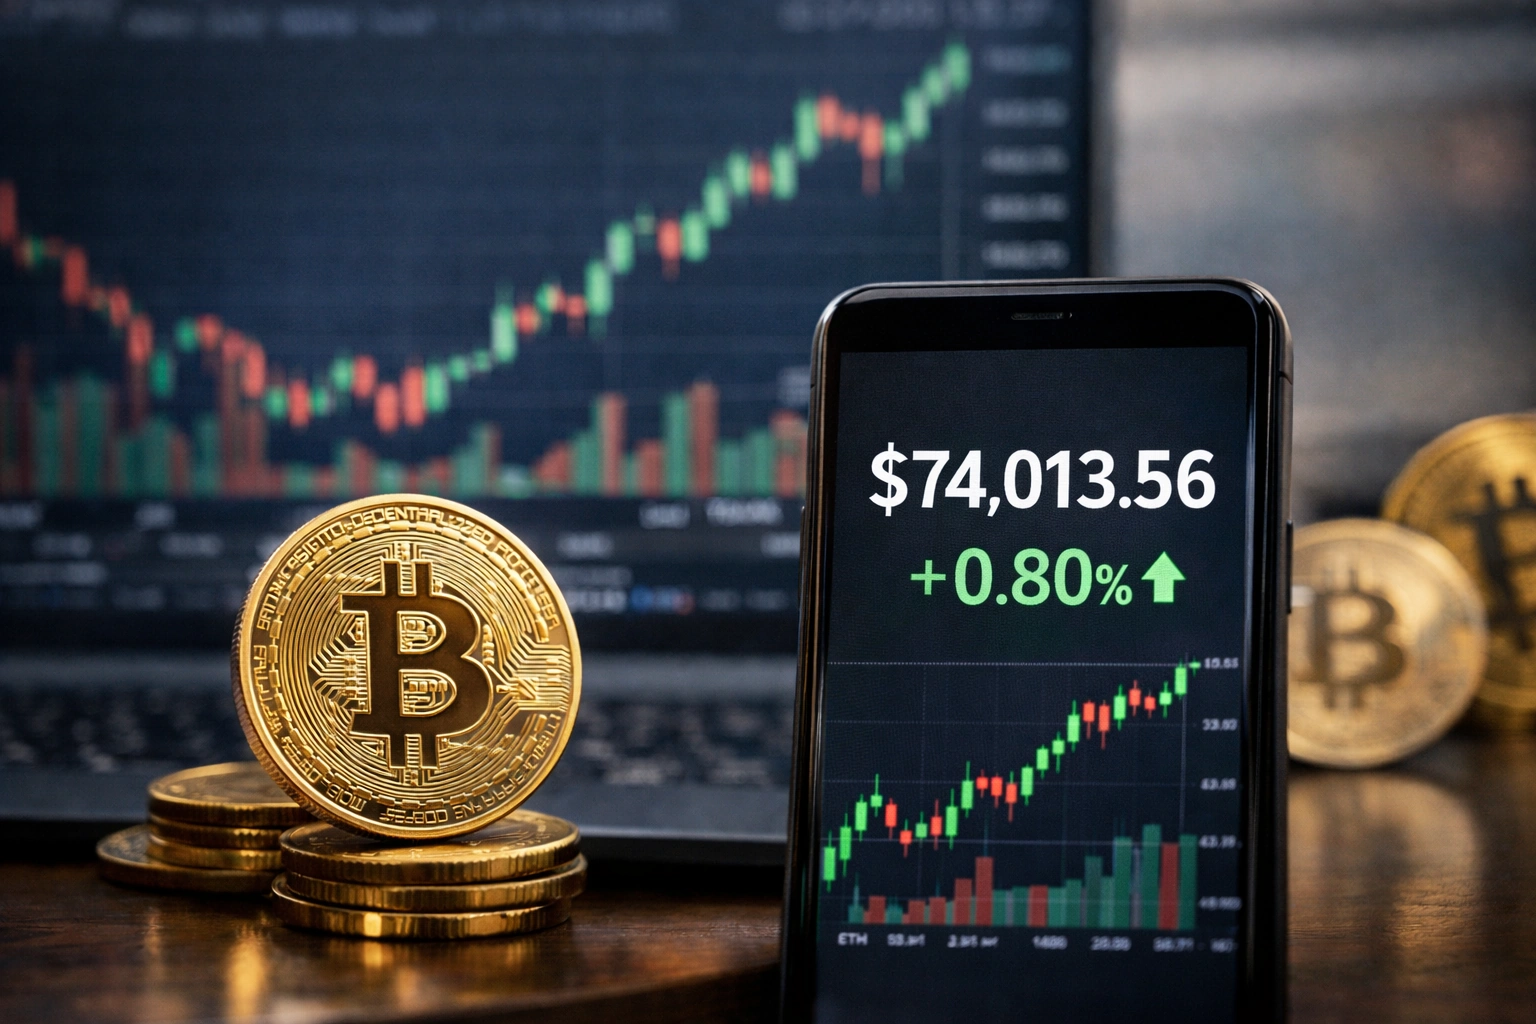
Coin Newsweek – March 5, 2026 (Updated: 02:30 UTC) – Bitcoin has shattered the $74,000 barrier, surging to $73,982.20 per coin and recording a solid 0.80% daily gain. The move, confirmed by OKX market data, represents Bitcoin’s continued ascent following its decisive breakout above $70,000 earlier this week, bringing the leading cryptocurrency within striking distance of its all-time highs.
This breakout follows a remarkable weekly performance that has seen BTC gain over 8% in the past seven days, establishing a clear uptrend and restoring confidence across the crypto ecosystem. With $74,000 now breached, traders are turning their attention to the psychological $75,000 level and the record highs beyond.
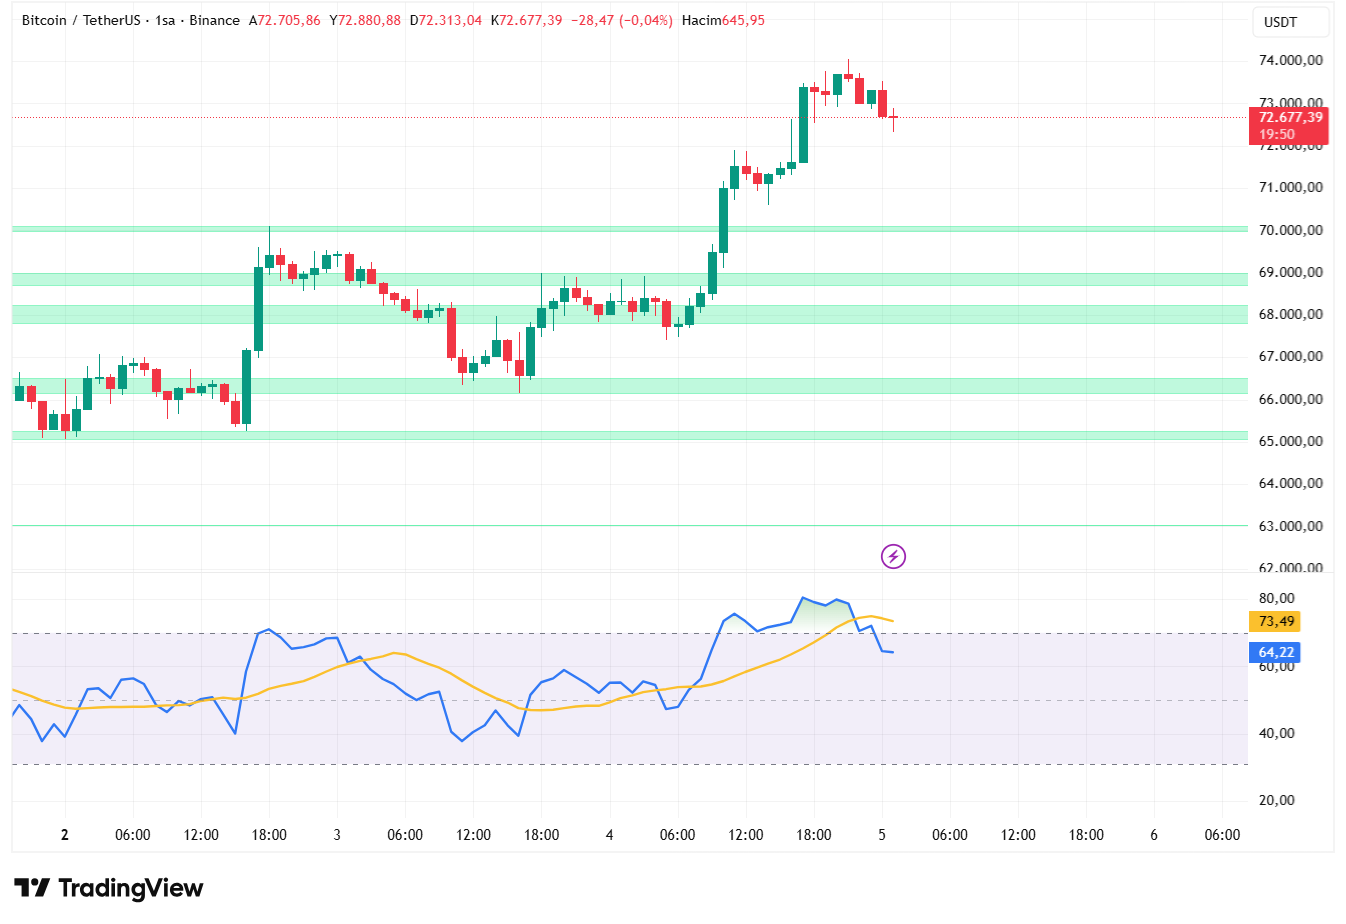
Chart 1: Bitcoin 1-hour chart showing price at $72,677.39 and RSI at 73.49 during the rally (Source: TradingView)
Technical Analysis: Breaking Down the Move
The 1-hour chart reveals the strength behind Bitcoin’s rally. After consolidating between $72,000 and $73,000, BTC broke decisively higher, touching $72,880.88 before settling at $72,677.39 at the time of the chart capture. The price has since continued its ascent, crossing the $74,000 threshold and confirming the breakout’s validity.
The Relative Strength Index (RSI) on the 1-hour timeframe has surged to 73.49, moving firmly into overbought territory. This reading indicates powerful buying momentum and strong conviction among market participants. While overbought conditions often precede short-term pullbacks, they also confirm the strength of the prevailing trend. In strong breakouts, RSI can remain elevated for extended periods as new buyers chase prices higher.
Volume analysis confirms the breakout’s legitimacy. Trading volumes have expanded significantly during the move, indicating genuine institutional and retail participation rather than thin-market manipulation. The hourly chart shows clean price action with minimal wicks, suggesting confident buying throughout the session.
The Bigger Picture: A Multi-Week Rally
Bitcoin’s move above $74,000 is the culmination of a multi-week recovery that began in late February. The cryptocurrency has now established a series of higher highs and higher lows, the classic definition of an uptrend. Key technical milestones include:
February 24: Bitcoin bounces off $62,500 support, beginning the current rally with a 13% surge.
March 4: BTC breaks decisively above $70,000, flipping key resistance into support.
March 5: Bitcoin breaches $74,000, setting the stage for a test of all-time highs.
This price action validates the bullish signals that have been accumulating: the Coinbase Premium Index turning positive, aggressive accumulation by long-term holders, and a textbook bullish divergence on the daily RSI.
Key Levels to Watch
With Bitcoin now trading firmly above $74,000, several critical levels come into focus for traders and investors:
Resistance Levels: The next major resistance sits at $75,000, a psychological barrier that could attract profit-taking. Above that, the all-time high near $77,000 represents the ultimate test for bulls. A clean break above $75,000 would likely accelerate momentum toward these record levels.
Support Levels: The newly breached $74,000 level now serves as immediate support. A successful retest of this level that holds would confirm the breakout’s validity. Below that, $73,000 and $72,000 (the previous resistance-turned-support) provide additional downside protection.
RSI Levels: The RSI at 73.49 suggests strong momentum, but traders should watch for a potential pullback toward 70, which would indicate cooling momentum while maintaining bullish structure. A drop below 60 would signal weakening and potentially warn of a deeper correction.
The Fundamental Backdrop: What’s Driving This Rally?
Several factors have converged to create conditions for Bitcoin’s sustained advance:
Institutional Demand: The Coinbase Premium Index remains positive, indicating sustained buying pressure from US-based institutional investors. This follows nearly 40 days of negative readings during the correction, suggesting that institutional capital is returning to the market.
Long-Term Holder Accumulation: Glassnode data reveals that wallets holding Bitcoin for 155 days or more have increased their positions dramatically. On March 3, the 155-day+ holder net position change stood at 27,225 BTC, roughly eight times higher than levels seen in early February. This suggests that sophisticated investors view current prices as attractive accumulation zones.
ETF Inflows: Bitcoin spot ETFs recorded their strongest inflow day since February, with $458 million entering these products on March 2. BlackRock’s IBIT led the charge with $263 million, and notably, none of the twelve ETFs experienced net outflows—a sign of broad-based institutional demand.
Macro Resilience: Despite ongoing geopolitical tensions in the Middle East and energy market volatility, Bitcoin has shown remarkable resilience. This decoupling from traditional risk assets has attracted capital seeking uncorrelated returns.
Bitcoin vs. Gold: A Tale of Two Safe Havens
Bitcoin’s outperformance becomes even more striking when compared to gold. While BTC has surged over 8% this week, gold has remained essentially flat, trading near $5,170 after correcting 8% from its recent highs above $5,400. This divergence occurs despite a macro backdrop that should theoretically favor the yellow metal: rising oil prices (Brent above $78) and a strengthening US Dollar Index (DXY near 99).
Bitcoin’s relative strength suggests that capital may be rotating from traditional safe havens into digital assets. Whether this represents a structural shift or temporary outperformance remains to be seen, but the immediate implications for market sentiment are clear.
Ethereum Follows: Altcoin Season Begins?
Bitcoin’s strength has begun to spill over into altcoins, with Ethereum breaking above $2,200 for a 2.14% gain. Historically, sustained Bitcoin breakouts are followed by capital rotation into Ethereum and major altcoins as traders seek higher beta exposure.
Ethereum’s RSI has surged to 71.36, confirming strong momentum. A decisive break above $2,250 would likely trigger significant short covering and attract momentum buyers. Other major altcoins, including Solana, Cardano, and XRP, are showing similar patterns of consolidation beneath resistance levels.
However, traders should note that not all altcoins will participate equally. Projects with strong fundamentals, active development, and genuine user adoption are likely to outperform those riding purely on speculative momentum.
Interpreting the RSI Signal
The RSI reading of 73.49 deserves special attention. On the 1-hour chart, this level indicates strong buying pressure and suggests that momentum could continue in the short term. However, traders should be aware that readings above 70 often precede brief consolidation periods as the market digests gains.
Key levels to watch on the RSI include a potential pullback toward 70, which would indicate cooling momentum but maintained bullish structure. A drop below 60 would signal weakening and potentially warn of a deeper correction. For now, the indicator confirms what the price action already suggests: buyers are firmly in control.
The Path Forward: What Comes Next for Bitcoin?
Bitcoin’s move above $74,000 represents a significant technical and psychological victory. After months of consolidation and uncertainty, the leading cryptocurrency has established a clear uptrend and is now within striking distance of its all-time highs.
For bulls, the focus now shifts to whether Bitcoin can maintain this momentum and push through the $75,000 barrier. A decisive break above this level would open the door to new all-time highs and could trigger the kind of FOMO (fear of missing out) that fuels parabolic moves.
For skeptics, the overbought RSI reading suggests a pullback may be imminent, providing an opportunity to test the strength of the breakout. A successful retest of $74,000 as support would confirm the bullish structure and provide confidence for further upside.
Regardless of short-term fluctuations, today’s action confirms that Bitcoin’s bull run is far from over. As one trader noted, “The wall of worry has been climbed. $70,000 was the last major hurdle. Now we’re heading into blue sky territory.”
Sources: OKX / TradingView / Glassnode / CryptoQuant / CoinGlass
Disclaimer: This content is for market information only and is not investment advice.

