Coin Newsweek – March 4, 2026 (Updated: 12:30 UTC) – Bitcoin has shattered the psychological $70,000 barrier, surging to $71,106 per coin and recording a powerful 5.01% daily gain. The move, confirmed by OKX market data, represents the most decisive breakout attempt since the correction from above $90,000 began, and signals a potential paradigm shift in market structure.
The rally validates the bullish signals that have been accumulating over the past two weeks: the Coinbase Premium Index turning positive, aggressive accumulation by long-term holders, and a textbook bullish divergence on the daily RSI. With $70,000 now acting as support rather than resistance, traders are turning their attention to the next technical targets and the sustainability of this momentum.
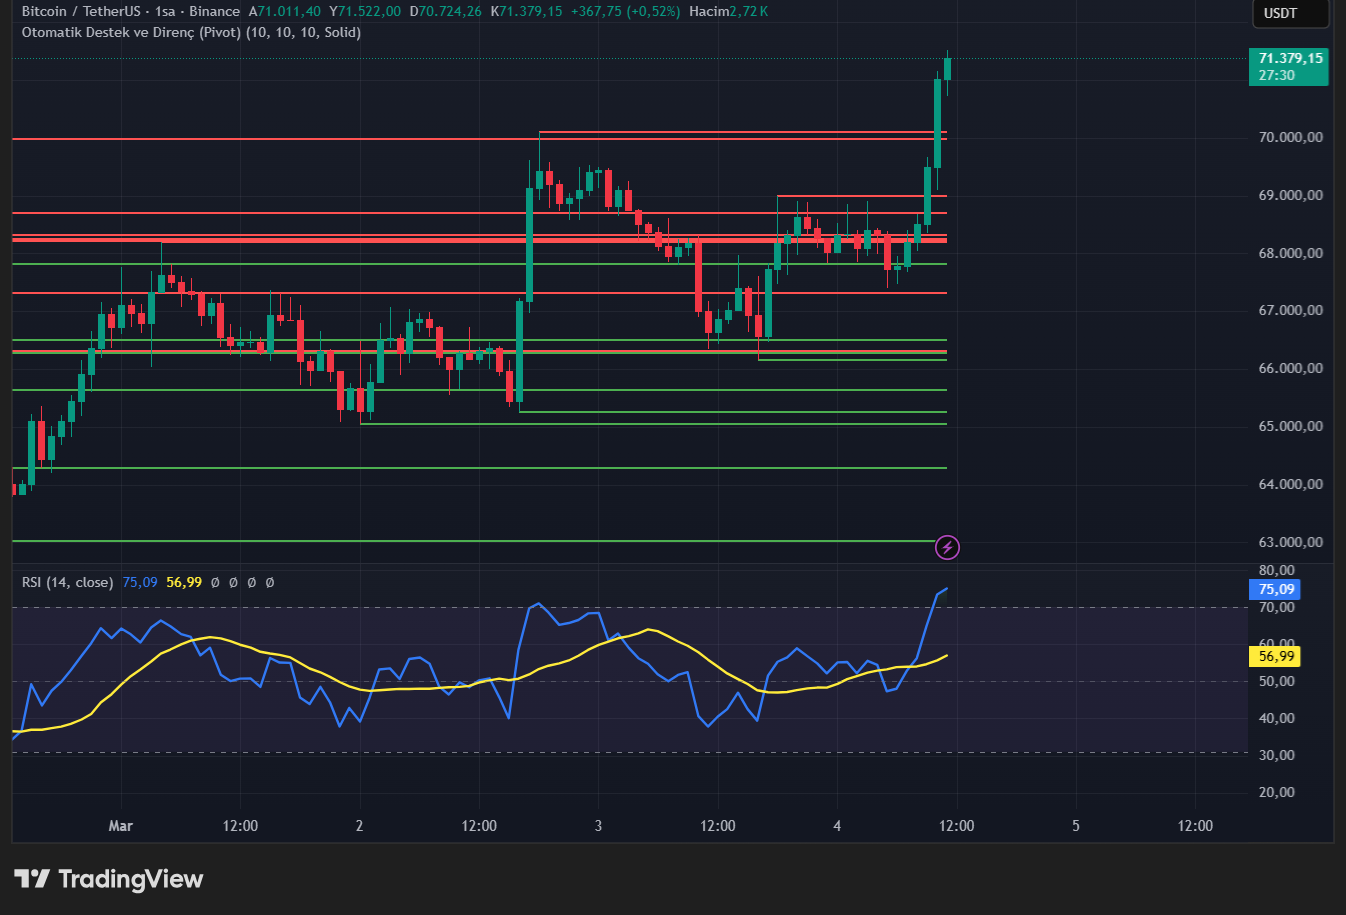
Chart 1: Bitcoin 1-hour chart showing price at $71,379 and RSI surging to 75.09 (Source: TradingView)
The Breakout: Technical Analysis of Bitcoin’s Move
The 1-hour chart reveals the intensity of today’s rally. Bitcoin is currently trading at $71,379, having briefly touched highs near $71,522 during the session. The price has decisively broken above the $70,000 level that had rejected multiple rally attempts since mid-February, flipping it from resistance to support.
The Relative Strength Index (RSI) on the 1-hour timeframe has surged to 75.09, moving firmly into overbought territory. This reading, up sharply from 56.99 earlier, indicates powerful buying momentum. While overbought conditions often precede short-term pullbacks, they also confirm the strength of the prevailing trend. In strong breakouts, RSI can remain elevated for extended periods as new buyers chase prices higher.
Volume analysis confirms the breakout’s legitimacy. Trading volumes have expanded significantly during the move, indicating genuine institutional and retail participation rather than thin-market manipulation. The hourly chart shows clean price action with minimal wicks, suggesting confident buying throughout the session.
The Foundation: What Fueled This Rally?
Today’s breakout did not occur in isolation. Multiple on-chain and technical signals have been aligning over the past two weeks to create conditions for a sustained move higher.
Coinbase Premium Turns Positive: The Coinbase Premium Index, which measures the price difference between Bitcoin on Coinbase and offshore exchanges, flipped positive in late February and has maintained that posture. This indicates that US-based institutional buyers are returning to the market after nearly 40 days of sustained selling pressure.
Long-Term Holder Accumulation: Glassnode data reveals that wallets holding Bitcoin for 155 days or more have increased their positions dramatically. On March 3, the 155-day+ holder net position change stood at 27,225 BTC, roughly eight times higher than levels seen in early February. This suggests that sophisticated investors view current prices as attractive accumulation zones.
Bullish RSI Divergence: The daily chart shows a classic bullish divergence, with price making lower lows between January and February while the RSI formed higher lows. This pattern often precedes trend reversals and has now resolved in favor of the bulls.
The $70,000 Barrier: From Resistance to Support
With Bitcoin now trading firmly above $71,000, the critical question is whether $70,000 will act as support in future pullbacks. The 1-hour chart shows price accelerating away from this level, suggesting strong conviction among buyers. A successful retest of $70,000 that holds would confirm the breakout and provide confidence for further upside.
The next major resistance levels are visible on the chart. After clearing $71,500, the path opens toward $72,200 and the psychologically important $75,000 level. Each of these zones may attract profit-taking, and consolidation between levels would be healthy for market structure.
On the downside, $69,500 and $68,800 serve as the nearest support levels. A break below $68,800 would put the bullish thesis in doubt and suggest that the breakout may have been a false dawn. However, the current RSI reading of 75.09 suggests momentum is strongly in favor of continued upside.
Market Implications: What’s Next for Altcoins?
Bitcoin dominance has risen during this move, reflecting the typical pattern where BTC leads and altcoins follow. Historically, sustained Bitcoin breakouts are followed by capital rotation into Ethereum and major altcoins as traders seek higher beta exposure.
Ethereum, currently trading near $2,071, is showing signs of awakening with its RSI climbing to 72.67. A decisive break above $2,100 would likely trigger significant short covering and attract momentum buyers. Other major altcoins, including Solana, Cardano, and XRP, are showing similar patterns of consolidation beneath resistance levels.
However, traders should note that not all altcoins will participate equally. Projects with strong fundamentals, active development, and genuine user adoption are likely to outperform those riding purely on speculative momentum. The current environment favors selective positioning rather than indiscriminate buying.
Gold vs. Bitcoin: A Tale of Two Safe Havens
The breakout gains additional significance when viewed against gold’s recent performance. While Bitcoin has surged 5%, gold has remained essentially flat on the week, trading near $5,170 after correcting 8% from its recent highs above $5,400. This divergence occurs despite a macro backdrop that should theoretically favor the yellow metal: rising oil prices (Brent above $78) and a strengthening US Dollar Index (DXY near 99).
Bitcoin’s relative strength suggests that capital may be rotating from traditional safe havens into digital assets. Whether this represents a structural shift or temporary outperformance remains to be seen, but the immediate implications for market sentiment are clear.
Interpreting the RSI Signal
The RSI reading of 75.09 deserves special attention. On the 1-hour chart, this level indicates strong buying pressure and suggests that momentum could continue in the short term. However, traders should be aware that readings above 70 often precede brief consolidation periods as the market digests gains.
Key levels to watch on the RSI include a potential pullback toward 70, which would indicate cooling momentum but maintained bullish structure. A drop below 60 would signal weakening and potentially warn of a deeper correction. For now, the indicator confirms what the price action already suggests: buyers are in control.
The Bigger Picture: A New Phase Begins
Today’s move above $71,000 represents more than just a technical breakout. It signals that the accumulation of the past weeks has reached critical mass, that sellers have been exhausted at key levels, and that buyers are finally willing to chase price higher. The convergence of on-chain, technical, and sentiment indicators suggests that this move has the potential to be sustained.
For long-term investors, the message is one of confirmation. The thesis that Bitcoin serves as a store of value, a hedge against monetary debasement, and a portfolio diversifier has been tested through months of consolidation and has emerged intact. For traders, the focus now shifts to managing risk and identifying the next opportunities in a market that has finally found its footing.
As one analyst noted, “The wall of worry has been climbed. $70,000 was the last major hurdle before all-time highs. What happens next will depend on whether this breakout attracts the kind of FOMO that fuels parabolic moves, or whether we consolidate and build a base for the next leg. Either way, the direction has been decided.”
Sources: OKX / TradingView / Glassnode / CryptoQuant / CoinGlass
Disclaimer: This content is for market information only and is not investment advice.

