
Coin Newsweek – February 25, 2026 – Bitcoin has staged a modest recovery from recent selling pressure, climbing back to $65,475 after testing support near $62,525. However, beneath this surface-level stabilization, technical and on-chain indicators paint a more cautious picture, suggesting the world’s largest cryptocurrency may face continued headwinds.
The recent price action saw Bitcoin break down from a symmetrical triangle pattern—a technical formation that often precedes significant moves. This breakdown had targeted a 14% decline from the breakout point, raising concerns about further downside potential. While the immediate selling pressure has eased, the technical damage from this breakdown may take time to repair.
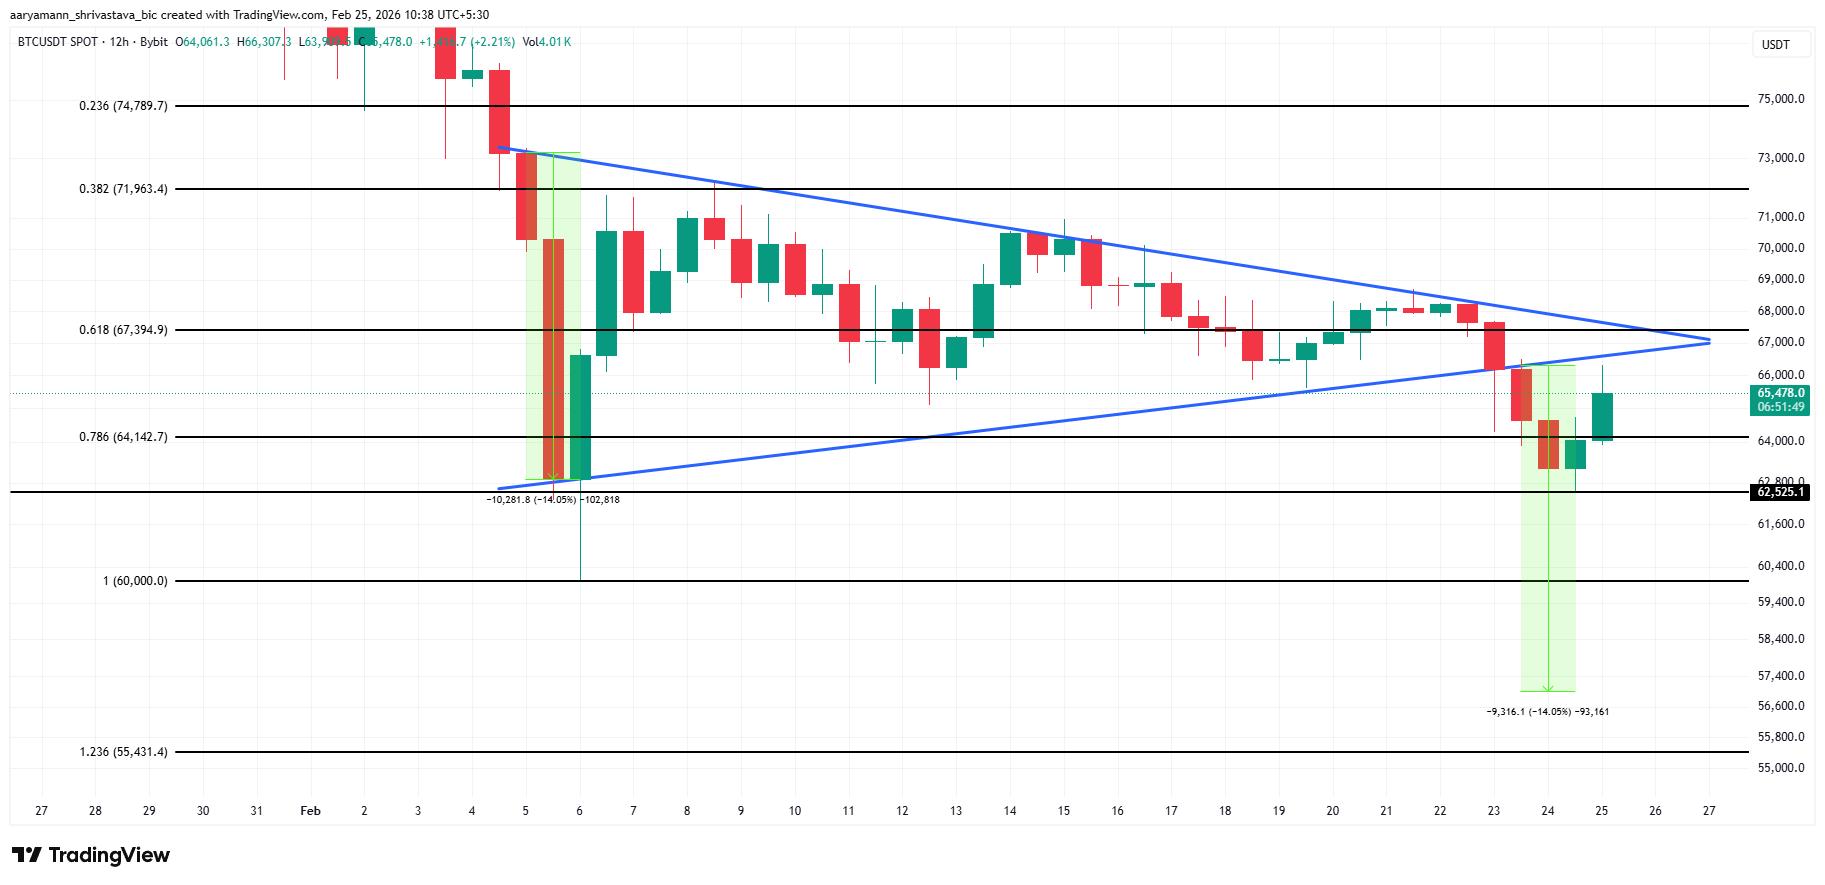
Chart 1: Bitcoin 12-hour chart showing the triangle breakdown pattern and key Fibonacci levels (Source: TradingView)
History May Offer Clues to Bitcoin’s Path Forward
The Realized Profit/Loss Ratio (90-day) has dipped below the critical 1.0 level, indicating that investors have been realizing more losses than gains over the past three months. This metric measures whether market participants are booking profits or accepting losses on their Bitcoin holdings. Values below 1.0 confirm that losses are dominating the realized outcome for recent transactions.
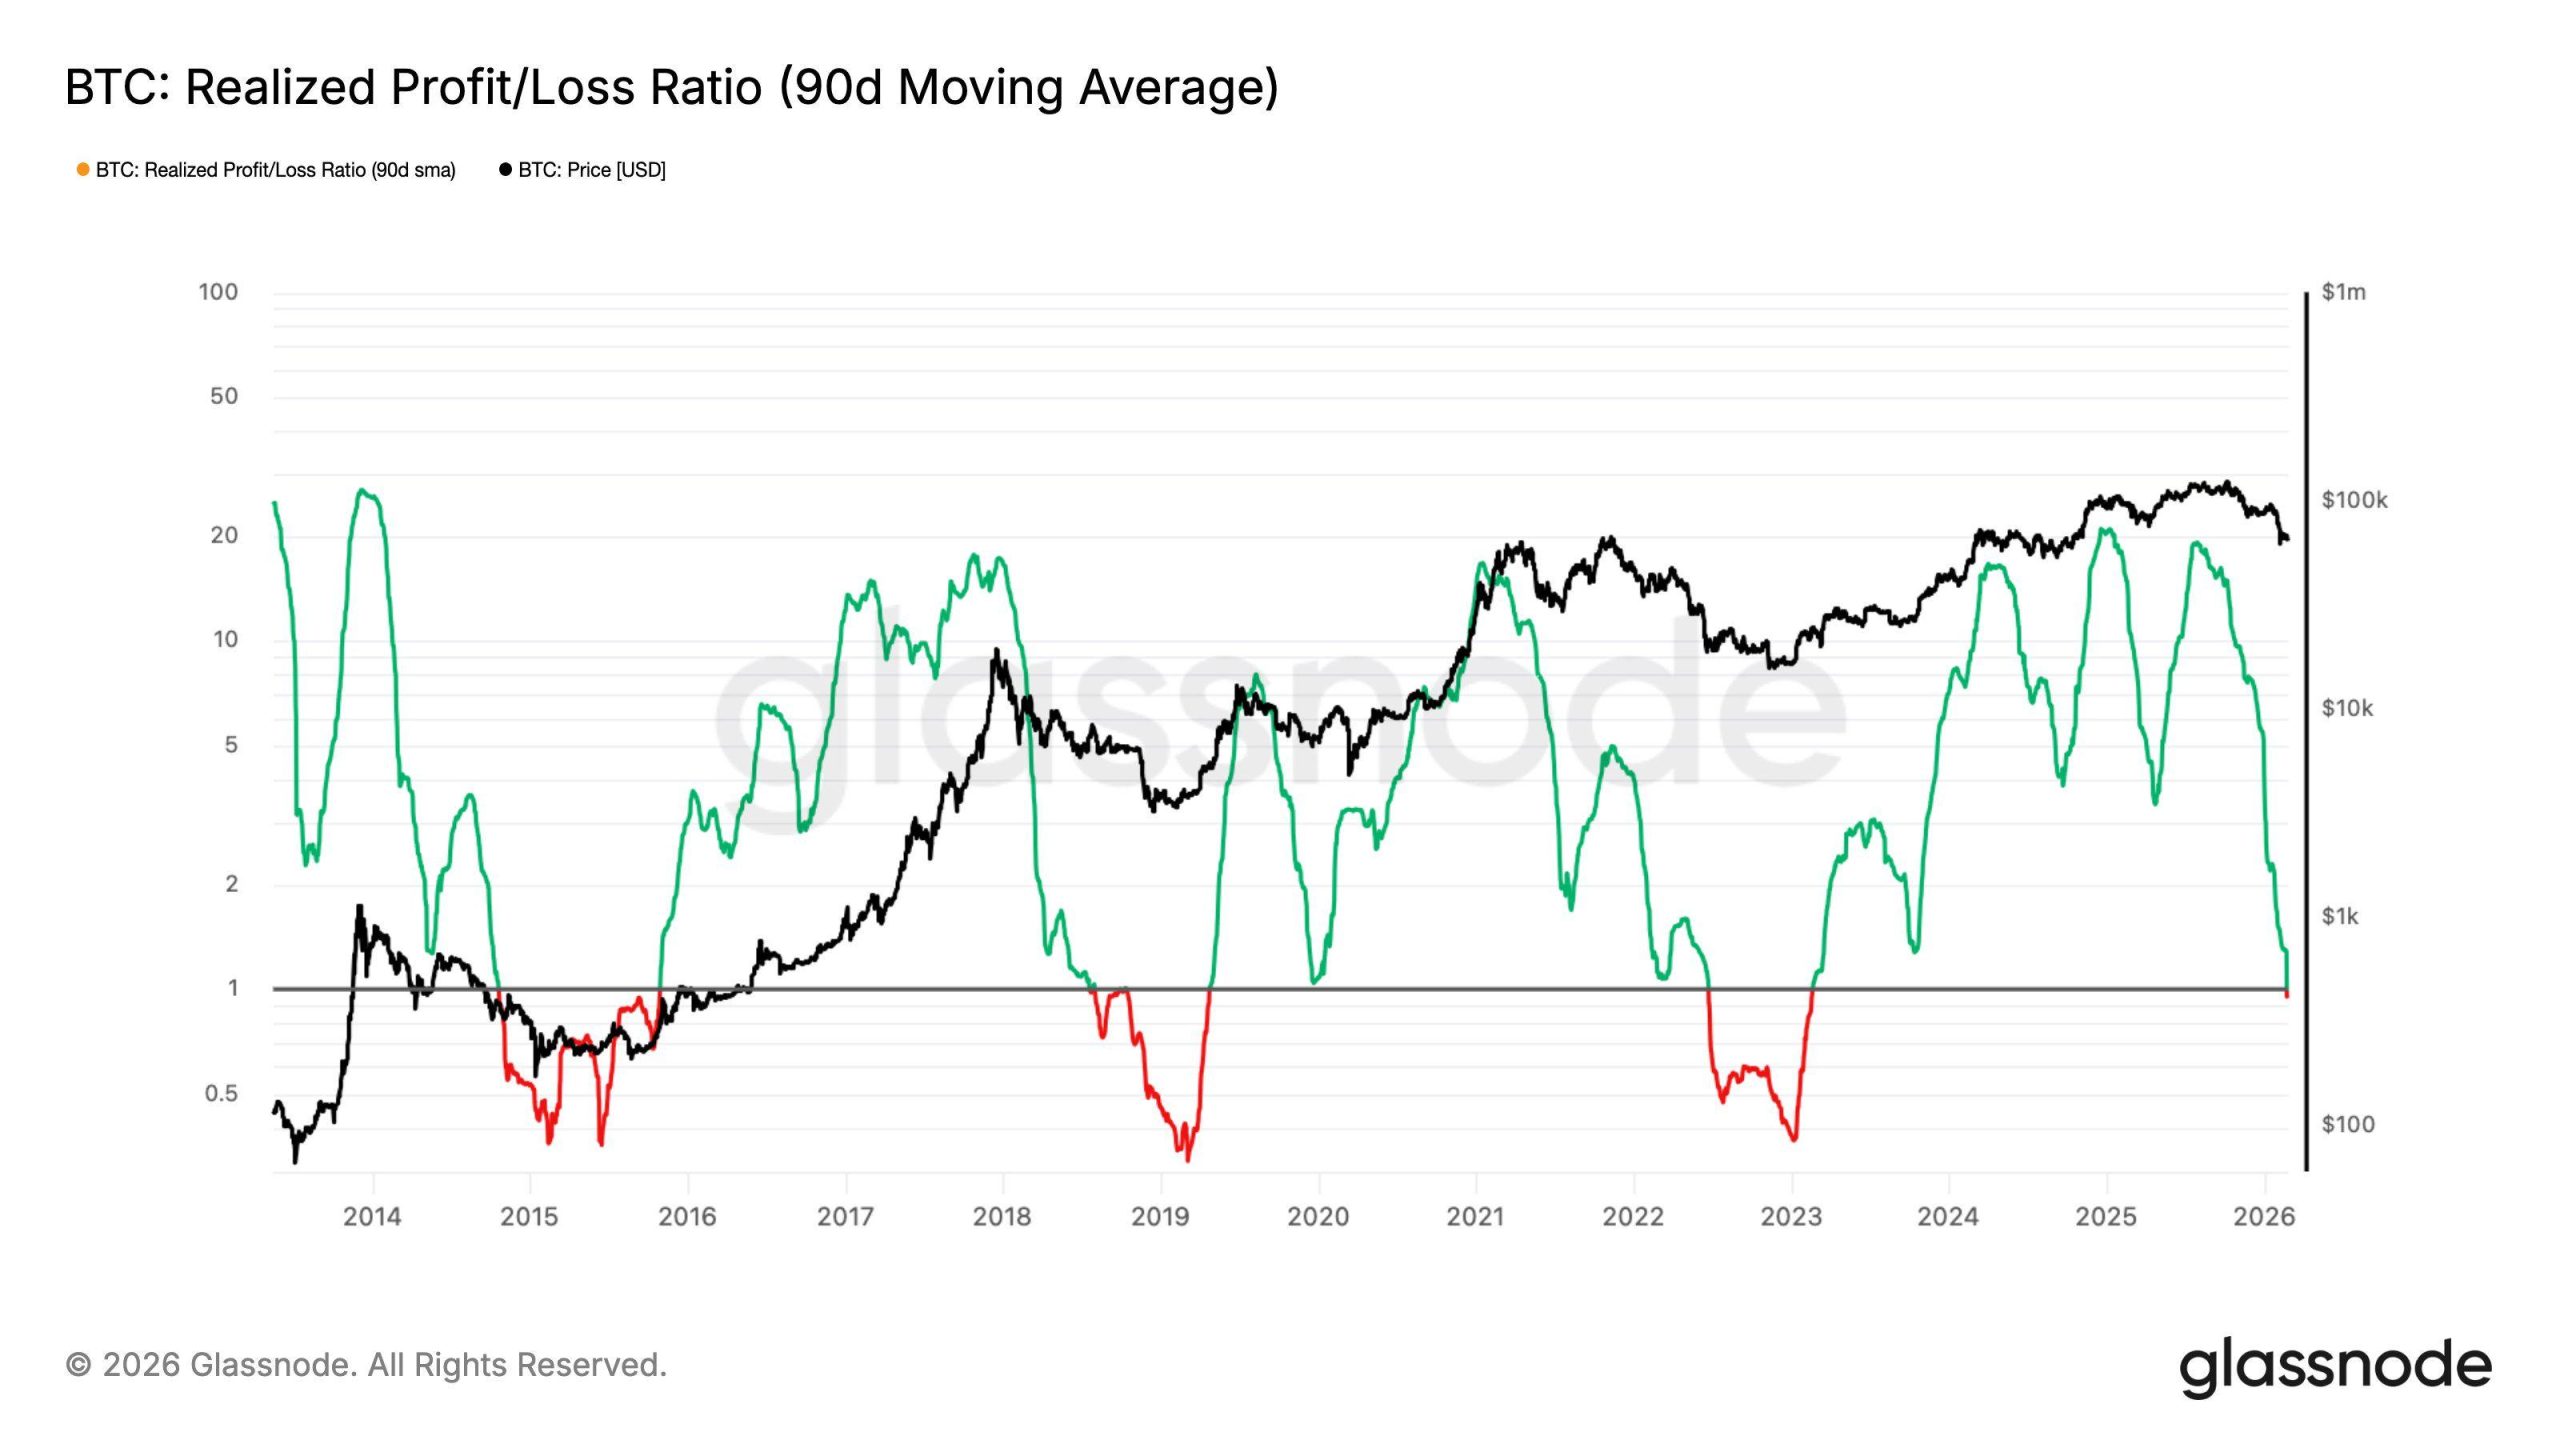
Chart 2: Bitcoin Realized Profit/Loss Ratio (90d moving average) vs. Price (2014-2026) (Source: Glassnode)
Historical data suggests that periods below this threshold can persist for six months or longer. A sustained move back above 1.0 typically coincides with strengthening liquidity and renewed capital inflows into the crypto ecosystem. Until such a reversal occurs, investor sentiment may remain defensive, limiting the potential for aggressive accumulation.
Whale Wallets Show Signs of Distribution
Supply distribution data reveals notable shifts among Bitcoin’s largest holders. Addresses containing between 1,000 and 10,000 BTC have been gradually reducing their positions. Over the past 12 days, their collective share of total supply has declined from 21.7% to 21.2%.
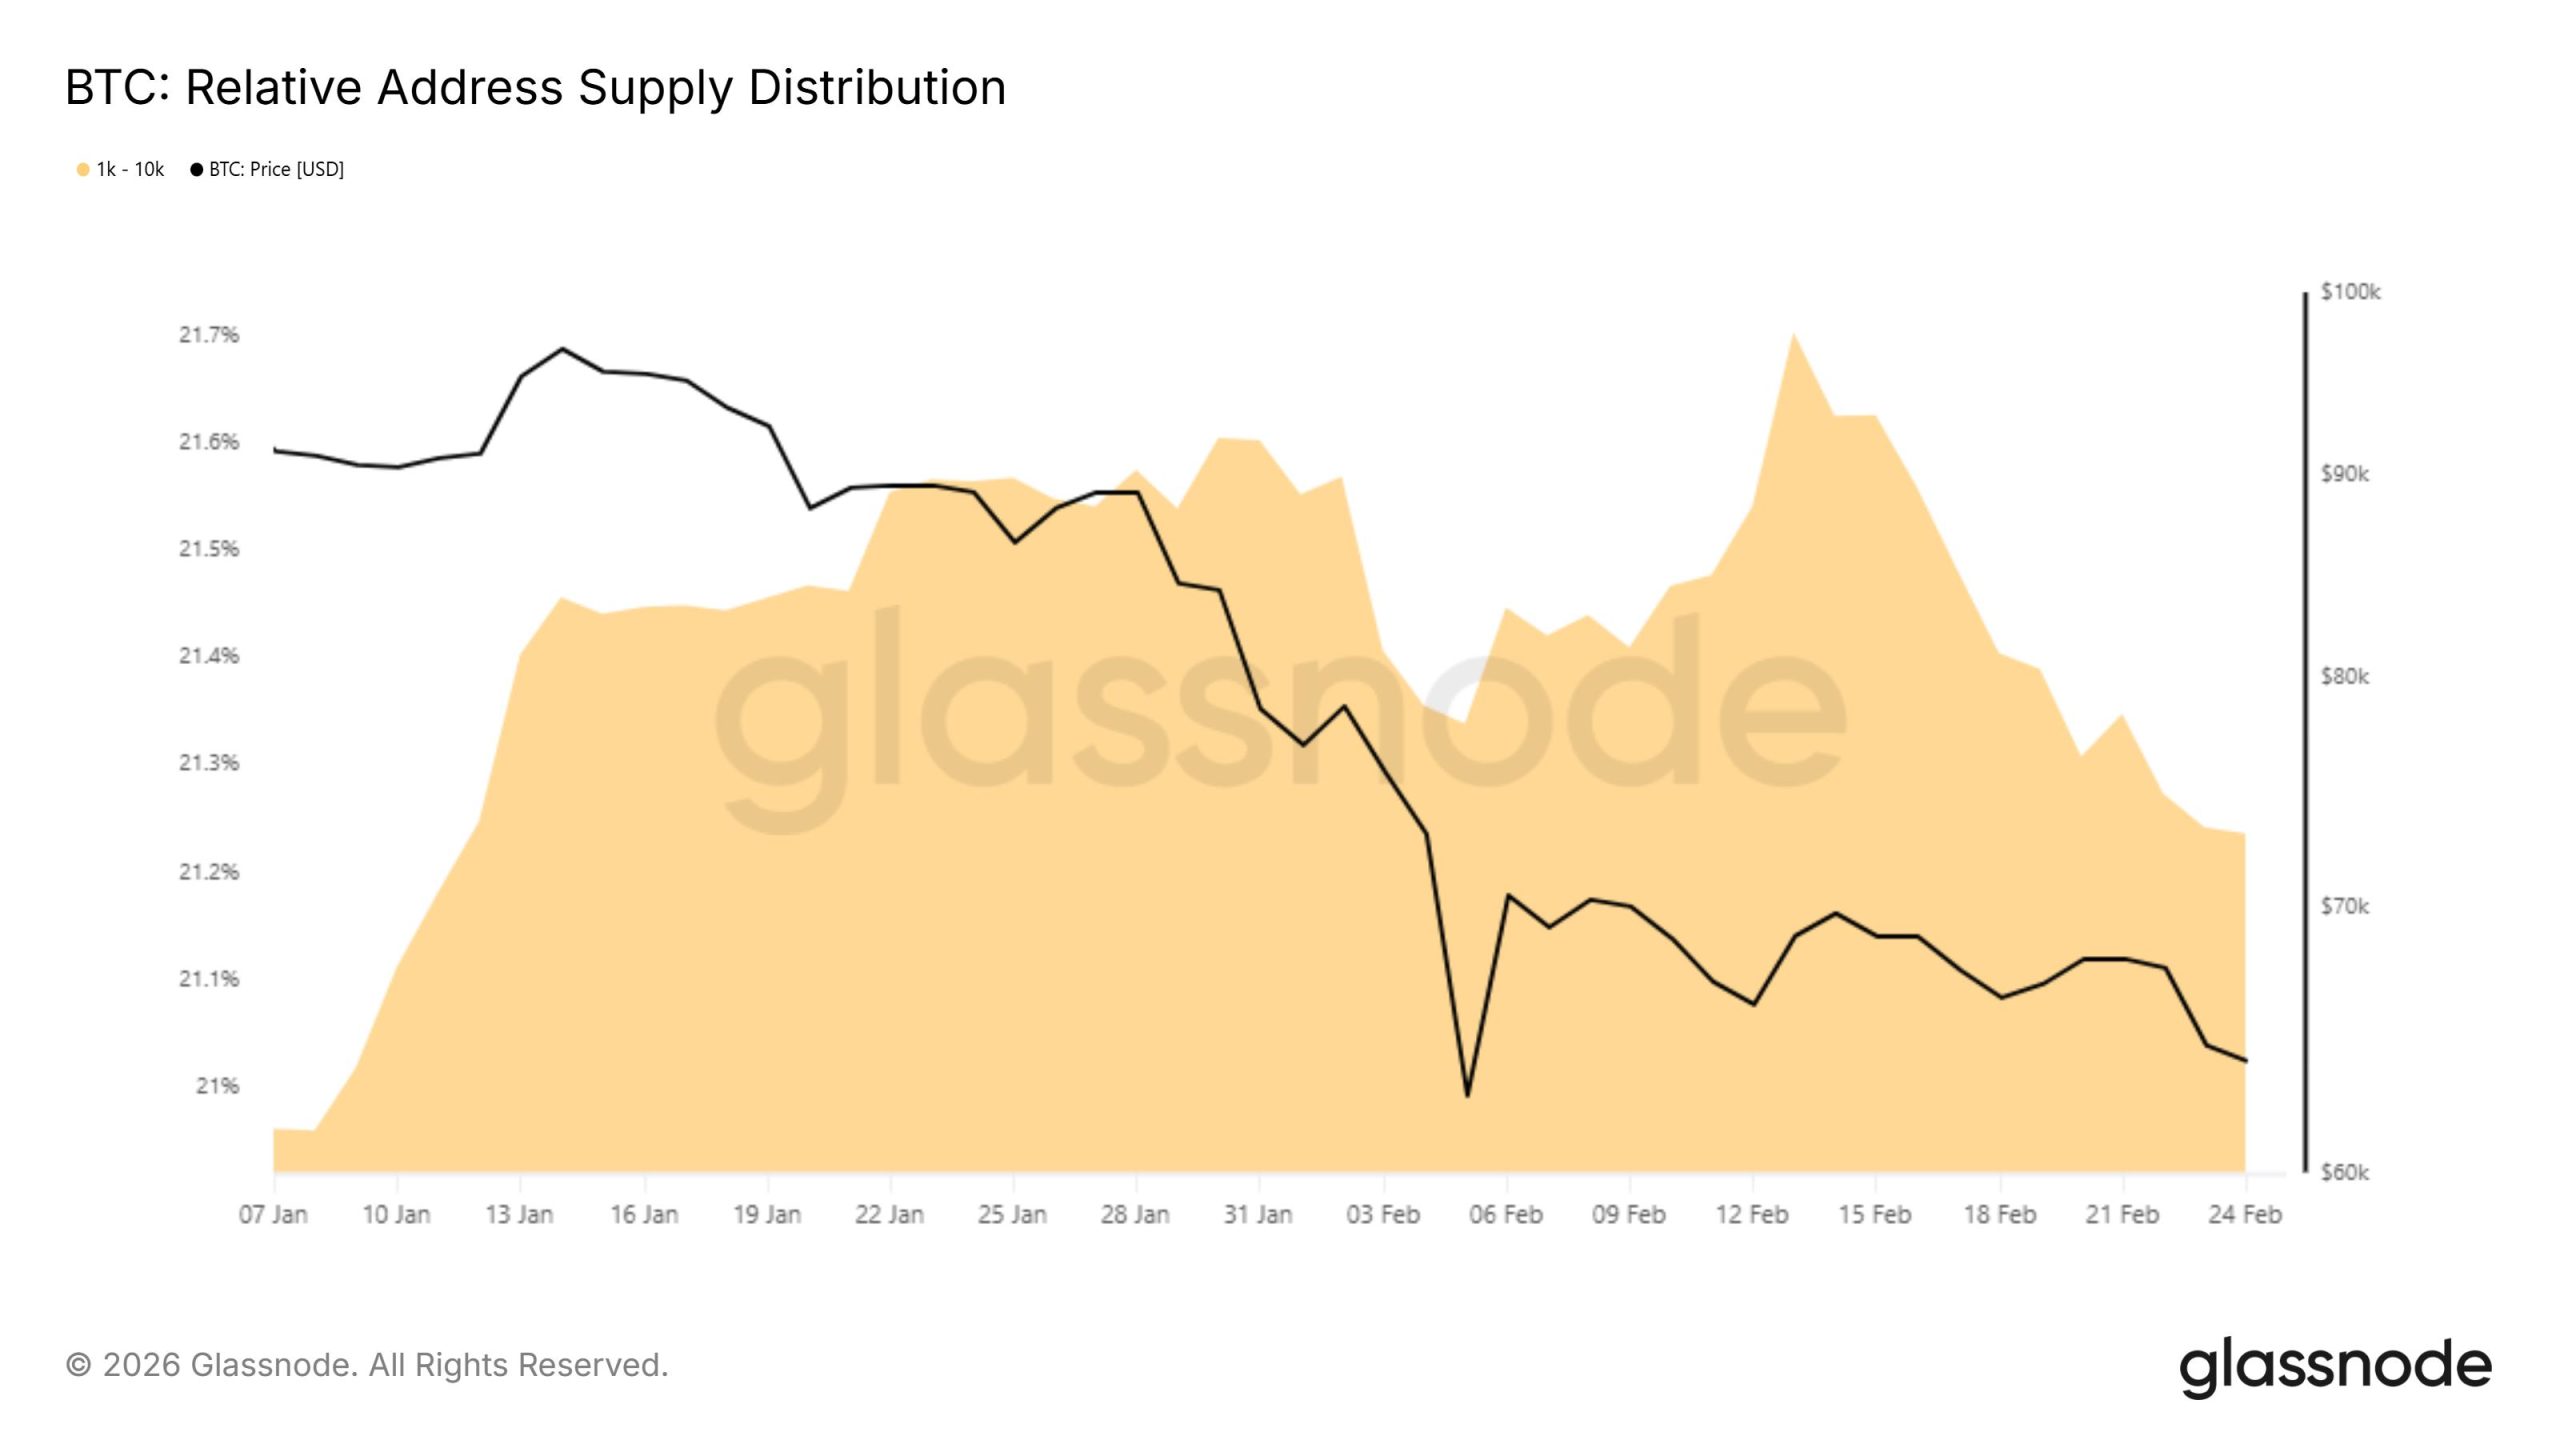
Chart 3: Bitcoin whale supply distribution data (1,000-10,000 BTC addresses) (Source: Glassnode)
This reduction represents approximately 90,000 BTC exiting these whale wallets, corresponding to roughly $5.8 billion in value at current prices. While the measured pace of selling provides some reassurance against sudden market shocks, the trend of large investors reducing exposure could undermine price stability if continued. Persistent distribution from these influential holders may cap upside potential in the near term.
Key Levels to Watch
With Bitcoin currently trading at $65,475 after bouncing from $62,525 support, traders are closely monitoring several critical price levels. The triangle breakdown had initially projected a decline to around $60,000, and this target remains relevant if bearish signals persist.
The $62,525 level now serves as immediate support. A sustained breakdown below this threshold could accelerate selling pressure, potentially triggering panic exits and deepening the correction toward the psychologically significant $60,000 mark. Loss of this level would likely invite further technical selling from traders positioned for downside.
On the upside, Bitcoin faces resistance at $67,394. A decisive move above this level would invalidate the bearish triangle breakdown and suggest structural improvement. Sustained strength above this resistance, despite on-chain warnings about liquidity and whale distribution, could signal at least a temporary bullish reversal.
The divergence between price action and on-chain fundamentals creates a complex picture for traders. The bounce from $62,525 demonstrates that buyers remain willing to step in at lower levels. However, the persistent loss dominance and whale distribution suggest that these buying efforts may face continued selling pressure.
For longer-term holders, the current environment may present accumulation opportunities if they believe the on-chain weakness is temporary. For traders, the conflicting signals argue for careful risk management and attention to the key technical levels that will determine Bitcoin’s next directional move.
The coming days will reveal whether the bounce from support can gain traction or whether the weight of on-chain bearish signals ultimately prevails. With whales reducing exposure and realized losses mounting, Bitcoin’s path of least resistance may remain sideways to down until fundamental conditions improve.
Sources: TradingView / Glassnode / Market data
Disclaimer: This content is for market information only and is not investment advice.

